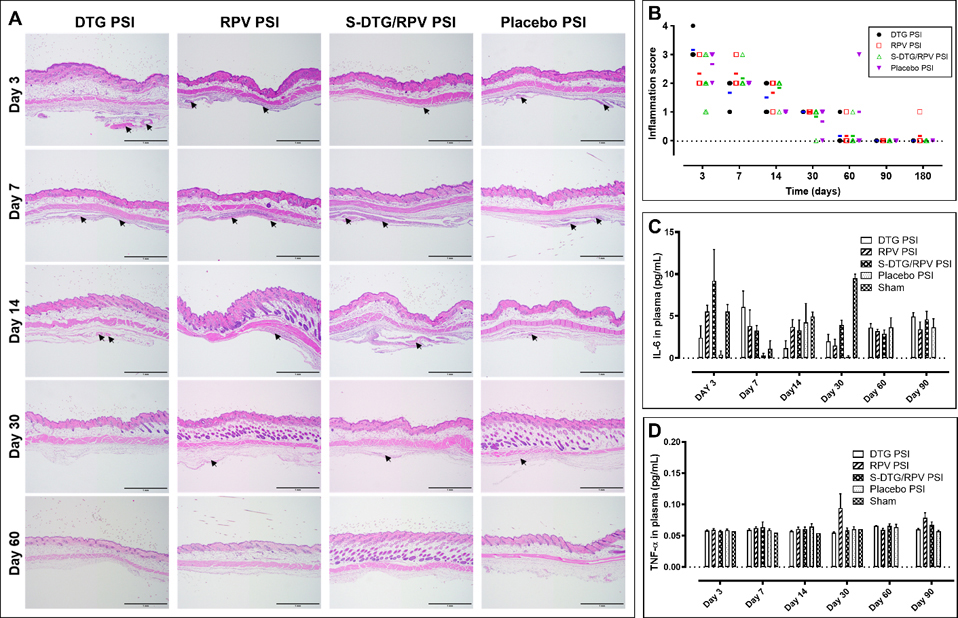
Figure 6.

In vivo safety evaluation of PSIs in BALB/c mice (n=7 per timepoint). A) Local inflammation of implanted subcutaneous tissues collected at day 3, 7, 14, 30, and 60 post-implantation and stained with H&E. Arrows indicate areas of inflammation identified by a certified anatomic pathologist. All scale bars represent 1 mm. B) Inflammatory scores of implanted subcutaneous tissues evaluated using light microscope, and blindly scored by a certified pathologist. The bars represent the median of inflammation scores in each group at each timepoint (n=7 per group). C) Concentration of IL-6 (pg/mL) in plasma post-PSI implantation quantified by ELISA (n=4 per group). D) Concentration of TNF-α (pg/mL) in plasma post-PSI implantation quantified by ELISA (n=4 per group).
