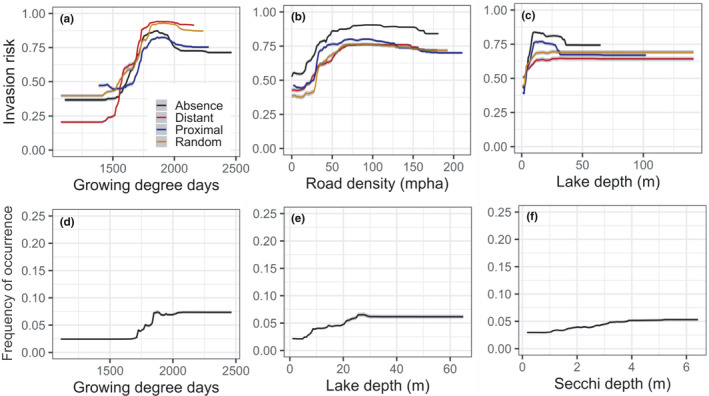
FIGURE 3.

Partial dependence plots of RF models showing the predicted effects of the top three predictors on (a–c) EWM invasion risk and (d–f) frequency of occurrence. Line colors in the top panel highlight the different occurrence models, with the black colored lines depicting presence–absence models. The y‐axis of the bottom panel is reduced to show the frequency of occurrence response curves with clarity
