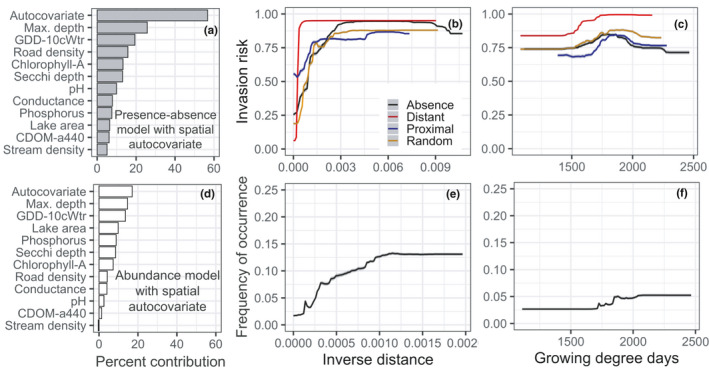
FIGURE 4.

Plots showing the effect of including a spatial autocovariate in RF models of invasion risk and frequency of occurrence. Left panel shows the relative importance of predictors after including the autocovariate in (a) presence–absence models of EWM invasion risk and (d) models of EWM frequency of occurrence. Middle and right panels show partial response curves of the autocovariate on EWM (b) invasion risk and (e) frequency of occurrence and the subsequent effect on response curves of growing degree days (c & f)
