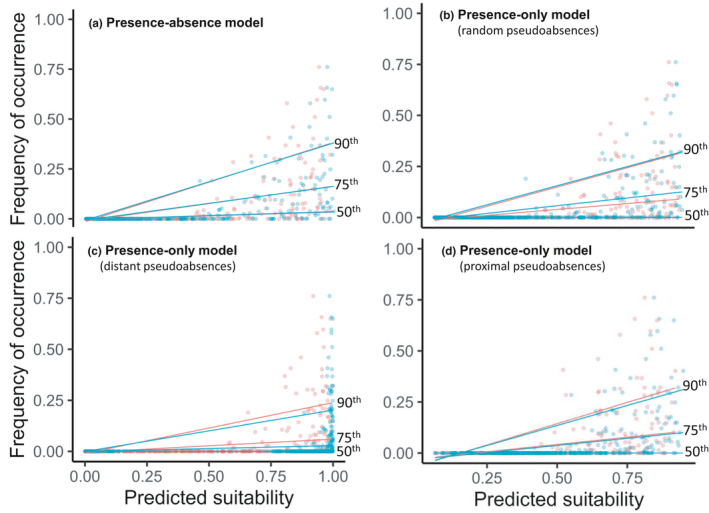
FIGURE 5.

Plots showing EWM abundance–suitability relationship where the predicted suitability is based on presence–absence and three distinct presence‐only datasets. Red‐ and blue‐colored dots indicate models with and without the spatial autocovariate, respectively, with the corresponding quantile regression lines shown at the 50th, 75th, and 90th percentiles. Pearson correlation coefficients (functional accuracy measures) associated with these plots are shown in Table 2. Quantile regression coefficients associated with the regression lines are reported in Table S2
