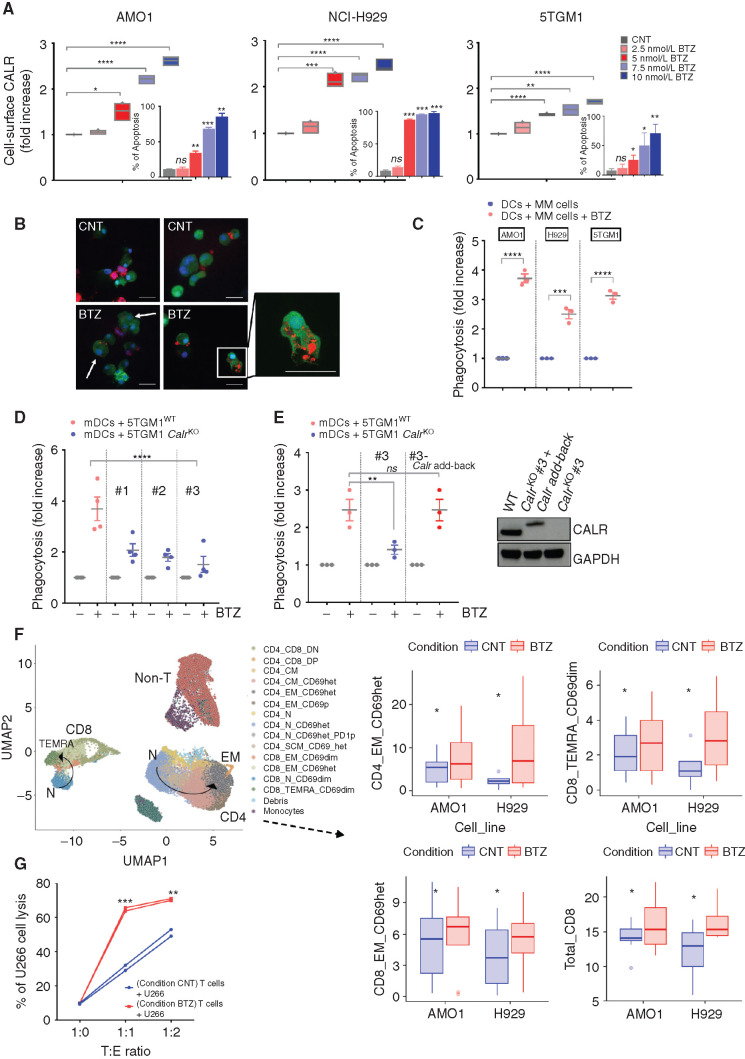
Figure 1.
BTZ induces ICD in multiple myeloma (MM) cells in vitro. A, Human AMO1, H929, and murine 5TGM1 multiple myeloma cell lines were treated with BTZ (1–10 nmol/L) or media (CNT) for 16 hours. CALR exposure was quantified by flow cytometry: Analysis of fluorescence intensity was assessed on viable (7-AAD–negative) cells. Floating bars show fold increase of the geometric mean normalized to CNT cells. Internal plots: percentage of apoptotic cells (Annexin-V positive) after BTZ treatment. Error bars are SD of three independent experiments for CALR analysis, and two experiments for apoptosis assays. P values were calculated by using two-tailed unpaired t test. B and C, For phagocytosis assays, Far Red–stained human AMO1, human H929, and murine 5TGM1 were left untreated or treated with BTZ for 16 hours. Then, they were cocultured with carboxyfluorescein diacetate succinimidyl ester (CFSE)–stained heterologous human DCs (hDC) or murine DCs (mDC), respectively. The JAWSII cell line was used as source of immature mDCs. Analysis was performed after 4 hours. In B are depicted representative confocal images showing interaction of mDCs (green) and 5TGM1 multiple myeloma cells (red), either untreated (CNT) or BTZ treated, after 4 hours of coculture. Scale bars, 20 μm. In C is shown the fold increase in percentage of double-positive DCs compared with CNT, as assessed by flow cytometry. Error bars are SEM of three independent experiments. Two-tailed unpaired t test. D, CFSE mDCs and 16-hour BTZ-treated or untreated Far Red-5TGM1WT or CalrKO (#1, #2, and #3) multiple myeloma cells were cocultured for 4 hours; fold increase in percentage of double-positive mDCs compared with CNT is shown. Error bars are SEM of four independent experiments. Unpaired t test to analyze the effect on each CalrKO clone compared with WT cells. E, Phagocytosis assay of BTZ-treated or untreated Far Red-5TGM1WT, CalrKO #3, or CalrKO #3 re-overexpressing Calr (#3 Calr add-back) cocultured with CFSE mDCs. Fold increase of percentage of double-positive mDCs compared with CNT is shown. Error bars are SEM of three independent experiments. Unpaired two-tailed t test. In the right plot, Western blot of CALR protein in 5TGM1WT, CalrKO #3, and CalrKO #3-Calr add-back is shown, with GAPDH as loading control. In the add-back clones, molecular weight of full-length Calr is larger than endogenous because its cDNA is in frame with the cDNA of the 5′ end of decay accelerating factor (DAF), which encodes a signal sequence for attachment of a glycophosphatidylinositol (GPI) anchor to the C-terminus of the resulting CALR–DAF fusion protein to facilitate CALR anchoring in the plasma membrane (44). F, Sixteen-hour BTZ-treated or untreated AMO1 and H929 cells were cocultured for 5 days with human DCs and T cells derived from the same healthy donors. CD4+ and CD8+ T cells were identified based on semiunsupervised bioinformatic analysis and are represented in a uniform manifold approximation and projection (UMAP) merging independent experiments for each cell line (left plot, arrows represent differentiation pattern). On the right plots, boxplots show absolute percentage of T-cell subsets that are significantly increased in the BTZ condition (according to ANOVA pairwise comparisons): CD4_EM_CD69het (P = 0.024), CD8_TEMRA_CD69dim (P = 0.029), CD8_EM_CD69het (P = 0.067), and total CD8 (P = 0.05). Data include eight independent experiments for the AMO1 cell line and four for the H929 cell line. Defining features of T-cell subset clusters are detailed in Supplementary Fig. S2A. G, Sixteen-hour BTZ-treated or untreated U266 cells were cocultured with HLA-matched hDCs and T cells from the same healthy donors. After 5 days, T cells were negatively selected from both coculture conditions (CNT and BTZ) and then cultured for 24 hours with new U266 cells prestained with CFSE at 1:0, 1:1, and 1:2 target:effector (T:E) ratio, followed by 7-AAD staining and quantification of multiple myeloma cell lysis by flow cytometry. Graph shows absolute percentage of dead multiple myeloma cells. ns, not significant; *, P < 0.05; **, P < 0.01; ***, P < 0.005; ****, P < 0.0001.

