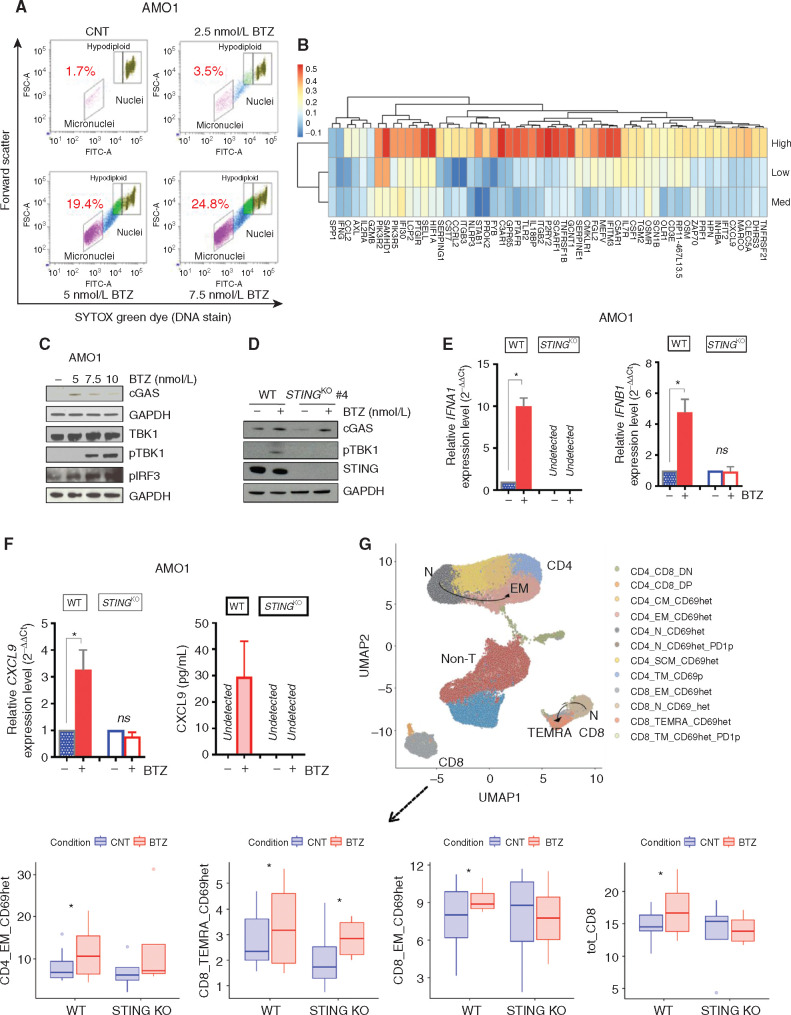
Figure 5.
BTZ induces IFNI signaling and promotes T-cell activation via the cGAS/STING pathway. A, AMO1 cells were treated with BTZ (0 to 7.5 nmol/L) for 16 hours. Viable cells were separated using Ficoll gradient centrifugation. Dot plots show micronuclei quantification as a percentage of diploid nuclei, as detected by flow cytometry. In the analysis, remaining apoptotic cells were gated out using ethidium monoazide dye that crosses the compromised outer membrane of apoptotic and necrotic cells. One of two experiments yielding similar results is shown. B, Heatmap shows the correlation analysis of 57 ISGs included in the ICD signature with STING/TMEM173 gene expression across the three subsets of patients with multiple myeloma (IFM/DFCI 2009 dataset) expressing high, medium, and low levels of the ICD signature (as in Fig. 4). Blue and red identify lower and higher correlation scores, respectively. C, Western blot (WB) analysis of the STING pathway in AMO1 cells treated with increasing doses of BTZ (5–10 nmol/L) for 16 hours. GAPDH was used as loading control to quantify cGAS, TBK1, phosphor-TBK1 (pTBK1), and pIRF3 expression. D, WB analysis of cGAS, pTBK1, and STING in AMOWT and STINGKO cells treated with BTZ (5 nmol/L). E, qRT-PCR analysis of IFNA1 and IFNB1 mRNAs in AMOWT and STINGKO cells either untreated or after BTZ (5 nmol/L). Raw cross threshold (Ct) values were normalized to GAPDH housekeeping gene and expressed as ΔΔCt values. Data are the average of three independent experiments performed in triplicate. ns, not significant; *, P < 0.05; unpaired t test. F, Analysis of modulation of CXCL9 in AMOWT and STINGKO cells after treatment with BTZ (5 nmol/L) for 16 hours by qRT-PCR analysis of CXCL9 mRNA (left) and ELISA quantification of extracellular CXCL9 (right). Data are means of two independent experiments ± SEM. *, P < 0.1 (unpaired Student t test) compared with untreated cells. G, BTZ-treated or untreated AMOWT and STINGKO cells were cocultured with human DCs and T cells from the same healthy donors for 5 days. Cells were analyzed using a bioinformatic pipeline, and results reported in a uniform manifold approximation and projection (UMAP) including n = 8 independent experiments for the AMO1WT cell line and n = 4 for the AMO1 STINGKO cell line (top). Bottom plots show absolute percentage of T-cell subsets and increase in BTZ-treated compared with CNT in both cell lines: CD4_EM_CD69het (AMOWT: P = 0.027; STINGKO: P = ns), CD8_TEMRA_CD69het (AMOWT: P = 0.1; STINGKO: P = 0.09), CD8_EM_CD69het (AMOWT: P = 0.064; STINGKO: P = ns), and total CD8 (AMOWT: P = 0.09; STINGKO: P = ns); *, P < 0.1; ANOVA pairwise. Defining features of T-cell subset clusters are detailed in Supplementary Fig. S8H.

