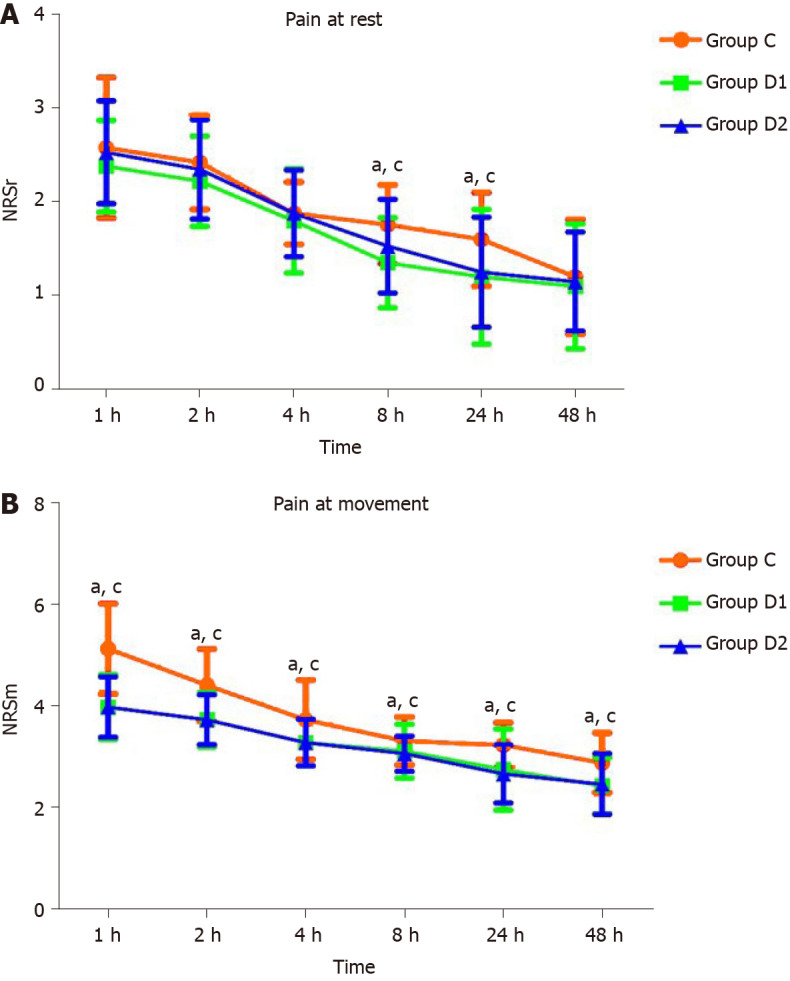
Figure 2.

Pain scores during 48 h after surgery in groups C, D1, and D2. Variables are presented as the mean ± SD. The numerical rating scale scores at 8 h and 24 h were significantly lower in groups D1 and D2 than in group C at rest and at movement. aP < 0.05, group D1 vs group C; cP < 0.05, group D2 vs group C. NRS: Numerical rating scale.
