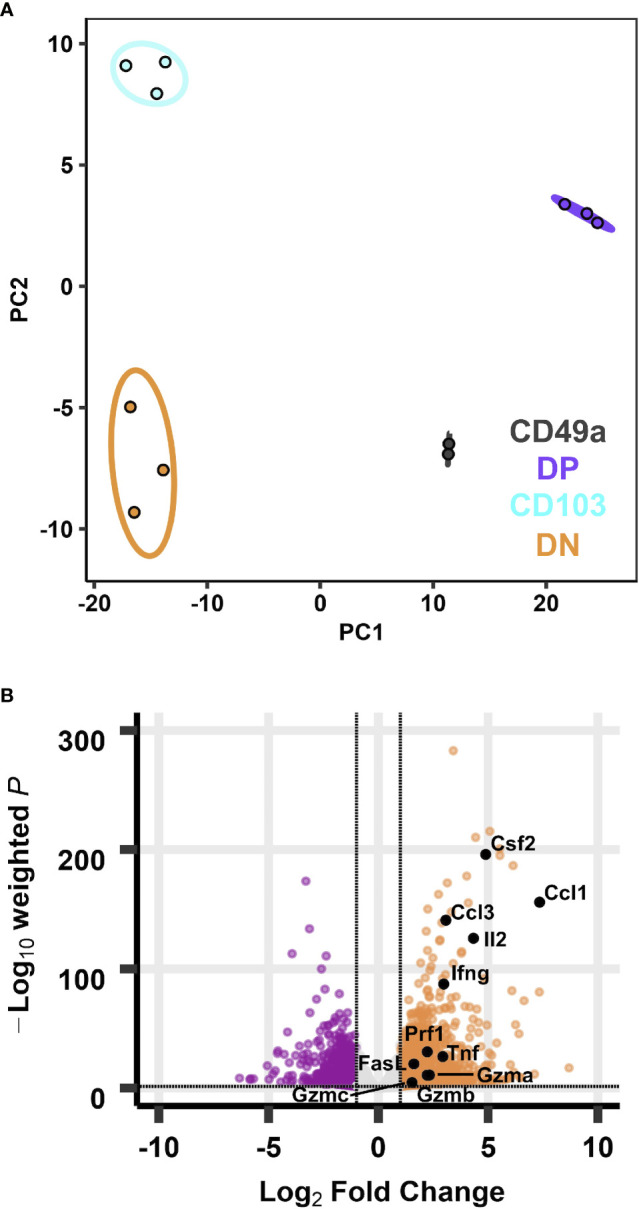
Figure 3.

Transcriptional profiles of integrin memory subsets are all distinct after in vitro re-stimulation. PCA of transcripts from CD49, DP, CD103, and DN populations (A) after five hours in vitro ⍺CD3/CD28 stimulation. Effector genes overlaid on the volcano plot of differentially expressed genes comparing DP with DN (B). Data are from three groups of five mice pooled and sorted based on integrin phenotype. One CD49a sample did not reach RNA quality cutoff and was excluded from the analysis.
