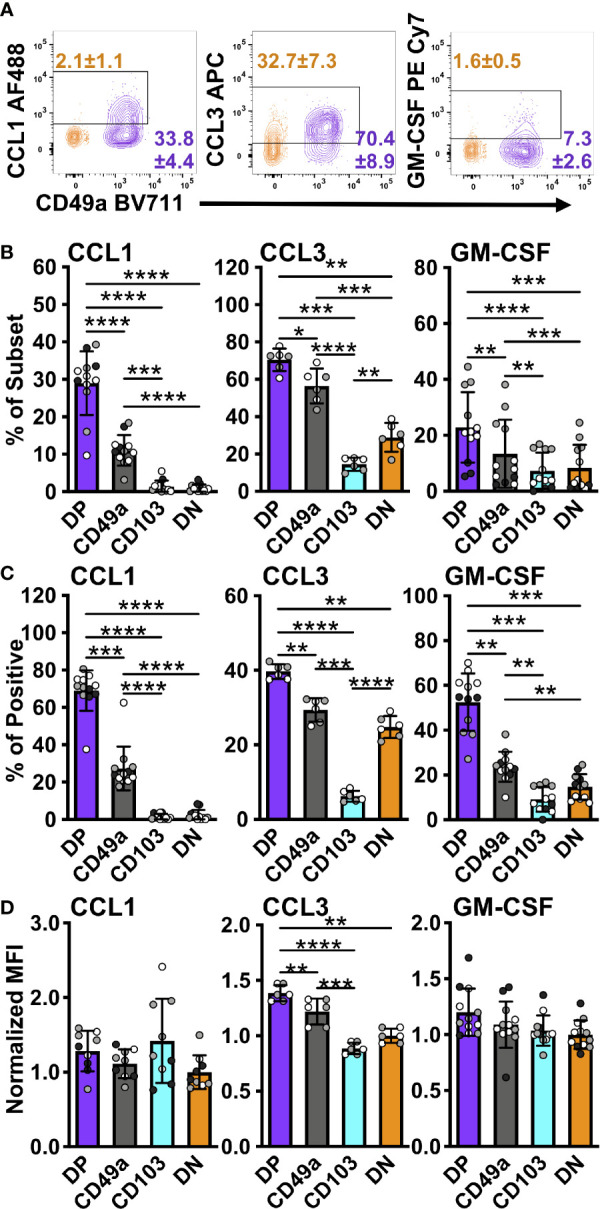
Figure 6.

DP and CD49a CD8 memory T cells express higher frequencies of chemokine and growth factor producing cells. Representative flow cytometry plots showing DP cells compared with DN cells after 6 hours of stimulation in vitro stimulation (A). Percentage of each subset positive for the chemokine (B) and percentage within the chemokine positive populations (C). MFI normalized to DN (D Data for (B–D) shown as mean with standard deviation and each individual sample. *p < 0.05 **p < 0.01 ***p < 0.001 ****p < 0.0001 based on a repeated measures one-way ANOVA with Greenhouse-Geisser correction, followed by post-hoc testing comparing all groups through Tukey’s multiple comparisons test. Data is two (CCL3) or three experiments combined with black, grey, or white indicating the individual experiment. n=6 for CCL3 n=12 for CCL1 and GM-CSF DP CD49a CD103 DN. DP-purple, CD49a-grey, CD103-aqua, DN-orange.
