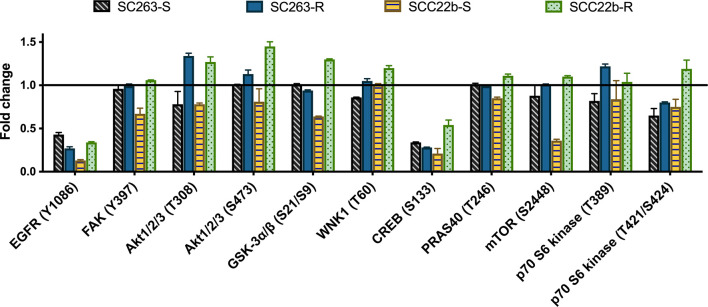
Figure 1.
Quantification of the human phospho-kinase array blots of cetuximab sensitive (SC263-S and SCC22b-S) HNSCC cell lines and corresponding acquired cetuximab resistant (SC263-R and SCC22b-R) variants. Graph represents the fold change of selected substrates, i.e. phosphorylated EGFR, Akt1/2/3 and other substrates involved in the Akt pathway, after cetuximab treatment. Protein phosphorylation profiling was conducted with one cell lysate. The fold changes were calculated by the ratio of the mean integrated optical density (duplicates) in treatment versus control groups. Error bars were calculated based on differences between duplicates. Suffix -S: cetuximab sensitive cell line and suffix -R: acquired cetuximab resistant cell line.

