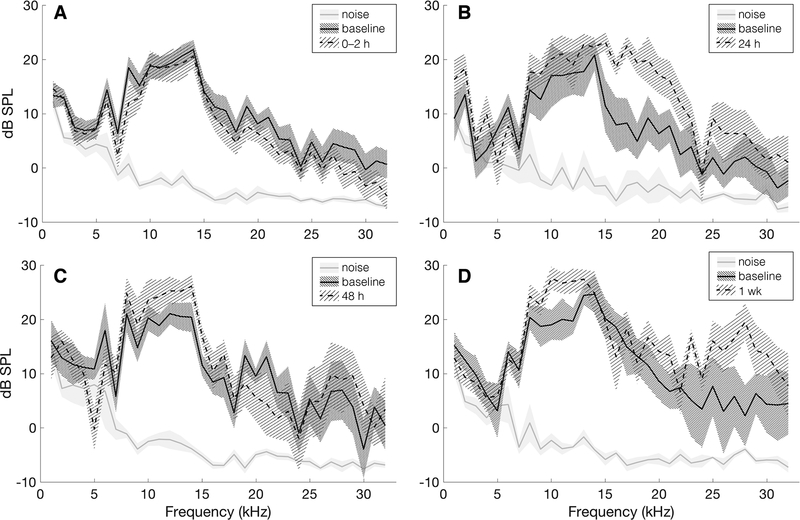
FIG. 6.
Distortion product otoacoustic emissions (DPOAE) at the frequency 2f1 – f2 in response to a 70 dB stimulus over all survival experiments at 0–2 hours (A, n = 18), 24 hours (B, n = 6), 48 hours (C, n = 6), and 1 week (D, n = 6) post-perforation. Solid gray lines show average noise for the plotted experiments and the shaded gray area shows two times the standard error of the noise. Solid black lines show the mean measured baseline DPOAE signal and densely shaded areas show two times the standard error. Dotted lines show mean DPOAE signal for 0–2 h, 24 h, 48 h, and 1 wk experimental time points and lightly shaded areas show two times the standard error for respective experiments. All experiments show DPOAE signals out of the noise and similar pre- and post-perforation measurements.

