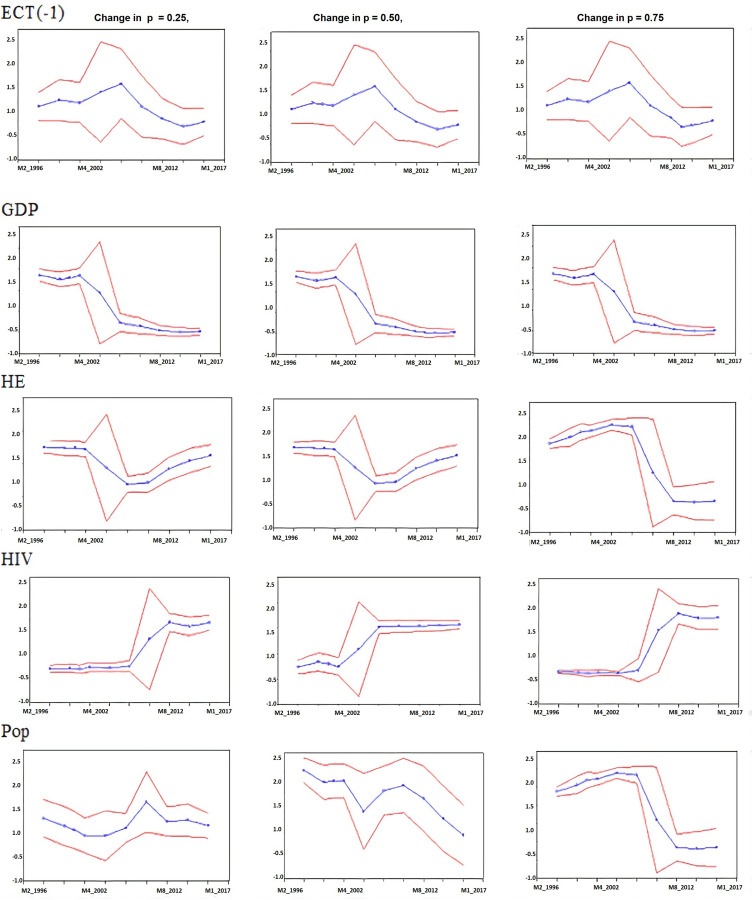
Figure 1.
Rolling window QARDL estimation results – life expectancy.
Notes: In Figure 1 ECT(−1), GDP, HE, HIV and POP are estimated parameters using the rolling window method for Life Expectancy, and each window has 0 observations. The 0.25, 0.5, 0.75 are considered three different quantile levels. The X-axis indicates the last date for the corresponding estimation window.

