Figure.
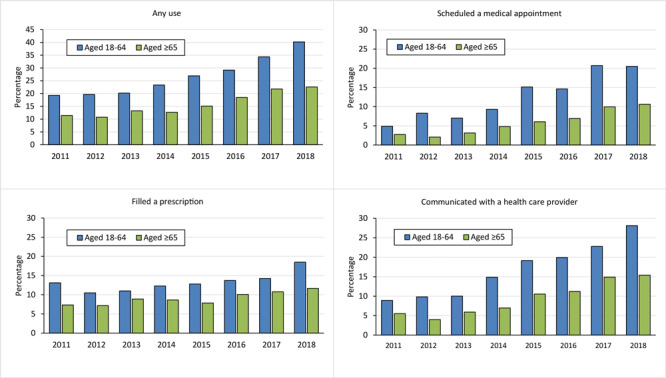
Increasing trend in internet-based health care communication use among cancer survivors stratified by age group, National Health Interview Survey 2011–2018. Any use of internet-based health care communication was defined as any use, in the past 12 months, of the following 3 types: communicated with a health care provider by email; filled a prescription on the internet; and scheduled a medical appointment on the internet. P value for the time trend was determined by using univariate logistic regression, where the dichotomized usage of internet-based health care communication (yes vs no) was the outcome variable, and survey year, treated as a continuous variable, was the explanatory variable. All Ps for trend ≤ .001.
| Year | Aged 18-64 | Aged ≥65 |
|---|---|---|
| Any use | ||
| 2011 | 19.3 | 11.4 |
| 2012 | 19.7 | 10.7 |
| 2013 | 20.2 | 13.2 |
| 2014 | 23.3 | 12.7 |
| 2015 | 26.9 | 15.1 |
| 2016 | 29.2 | 18.5 |
| 2017 | 34.4 | 21.8 |
| 2018 | 40.2 | 22.6 |
| Filled a prescription | ||
| 2011 | 13.1 | 7.3 |
| 2012 | 10.5 | 7.2 |
| 2013 | 11.0 | 8.9 |
| 2014 | 12.3 | 8.6 |
| 2015 | 12.8 | 7.8 |
| 2016 | 13.7 | 10.1 |
| 2017 | 14.2 | 10.8 |
| 2018 | 18.5 | 11.7 |
| Scheduled a medical appointment | ||
| 2011 | 4.9 | 2.7 |
| 2012 | 8.3 | 2.1 |
| 2013 | 7.0 | 3.1 |
| 2014 | 9.3 | 4.8 |
| 2015 | 15.1 | 6.1 |
| 2016 | 14.6 | 6.9 |
| 2017 | 20.7 | 10.0 |
| 2018 | 20.5 | 10.6 |
| Communicated with a health care provider | ||
| 2011 | 8.9 | 5.5 |
| 2012 | 9.8 | 4.0 |
| 2013 | 10.0 | 5.9 |
| 2014 | 14.9 | 7.0 |
| 2015 | 19.1 | 10.5 |
| 2016 | 19.9 | 11.2 |
| 2017 | 22.8 | 14.9 |
| 2018 | 28.1 | 15.4 |

