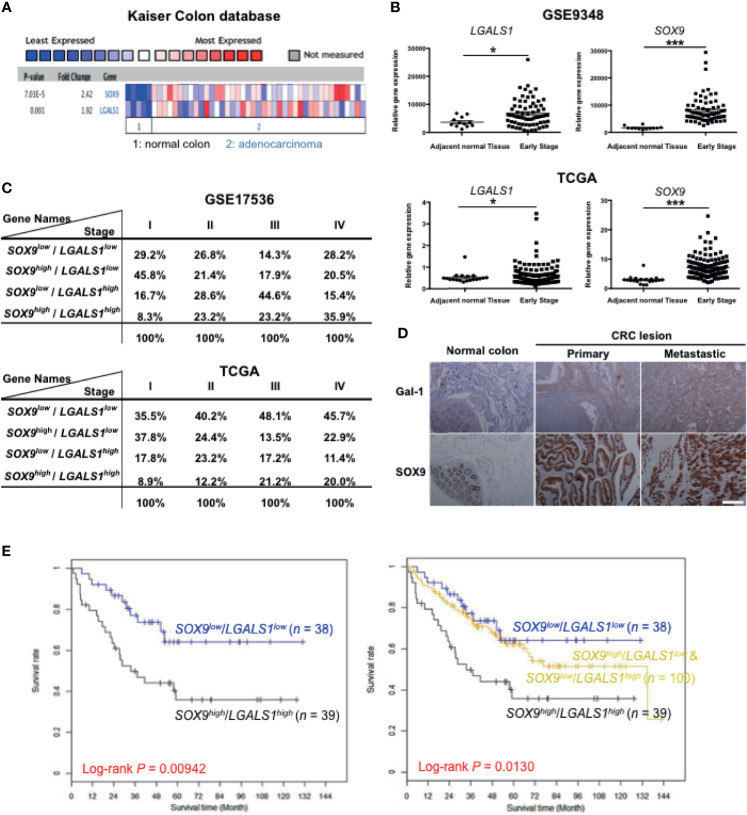
Figure 6.
High expression of Gal-1 and SOX9 correlate with clinical CRC outcome. (A) ONCOMINE assessment of the expression levels of LGALS1 and SOX9 in the Kaiser Colon database. (B) Analysis of LGALS1 or SOX9 expression levels in tumor tissue compared to adjacent normal tissue using GSE9348 (top panel) and The Cancer Genome Atlas (TCGA) databases (bottom panel). *p < 0.05 and ***p < 0.005 for early-stage lesions compared to adjacent normal tissue. (C) Analysis of LGALS1 and SOX9 expression levels to the CRC stage using the GSE17536 and TCGA datasets. (D) Immunohistological staining of Gal-1 and SOX9 on CRC tumor samples, which included 40 primary lesions (primary), 10 metastatic lesions (metastatic), and 9 normal colon samples; scale bar, 100 μm. (E) Kaplan-Meier survival curves of four groups of CRC patients as stratified by median expression levels of SOX9 and Gal-1 in tumor tissue: SOX9low/Gal-1low, n = 38; SOX9low/Gal-1high & SOX9high/Gal-1low, n = 100; and SOX9high/Gal-1high, n = 39. Survival analyses was performed for two groups: SOX9high/Gal-1high versus SOX9low/Gal-1low (left-side graph); or for three groups: SOX9high/Gal-1high versus SOX9high/Gal-1low + SOX9low/Gal-1high versus SOX9low/Gal-1low (right-side graph).

