Figure 3.
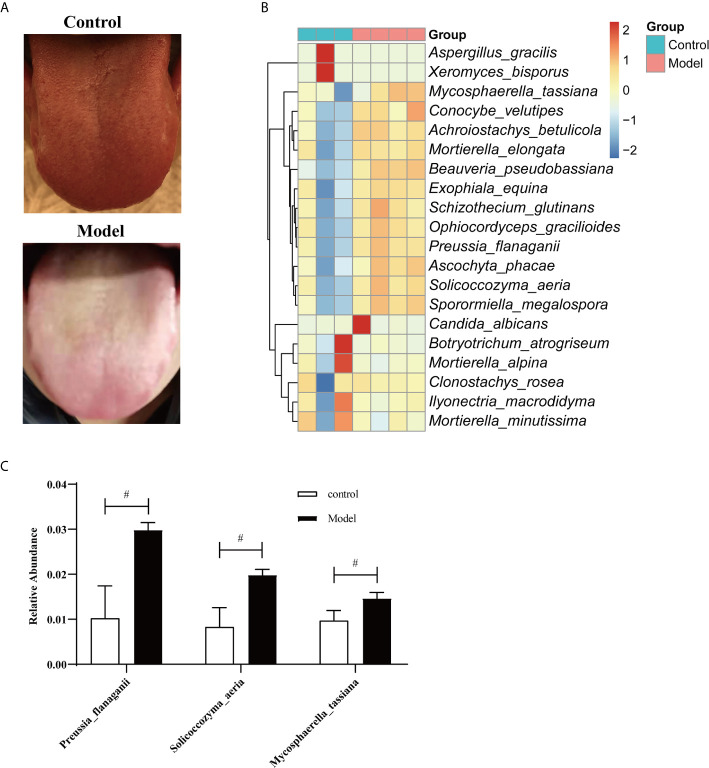
Fungal microbiome in saliva from humans during HTHH conditions (A) The appearance and morphology of the tongue coatings are different. (B) Heatmap of the fungal microbiome at the species level. The x-coordinate represents species, and the 20 species with the lowest p values are shown. The ordinate represents the relative abundance of species. Columns of different colors represent each sample. (C) The three with the greatest changes in abundance at the species level (t-test). #p < 0.05.

