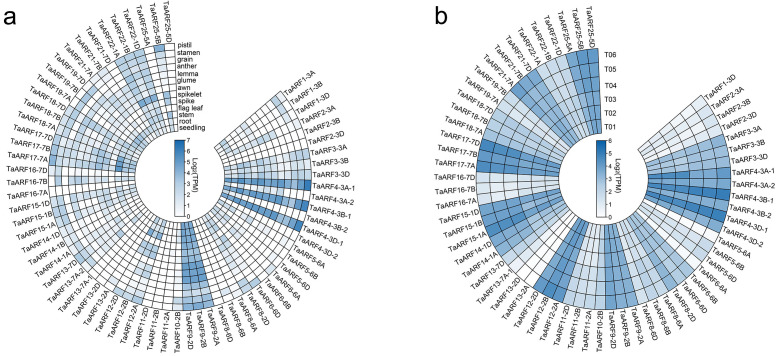
Figure 9. Expression profiles of TaARFs in various organs or tissues.
(A) Heatmap of expression profiles of TaARFs in various organs or tissues of Chinese Spring from the Wheat Expression Browser (http://www.wheat-expression.com/). (B) The heat map of expression profiles of TaARFs in tiller primordia of WT and dmc based on transcriptome data. Three biological replicates were set up in the mutant dmc (T01, T02 and T03) and WT (T04, T05 and T06), and each sample bulk of tiller primordia included more than 10 independent individuals.

