
Fig. 2.
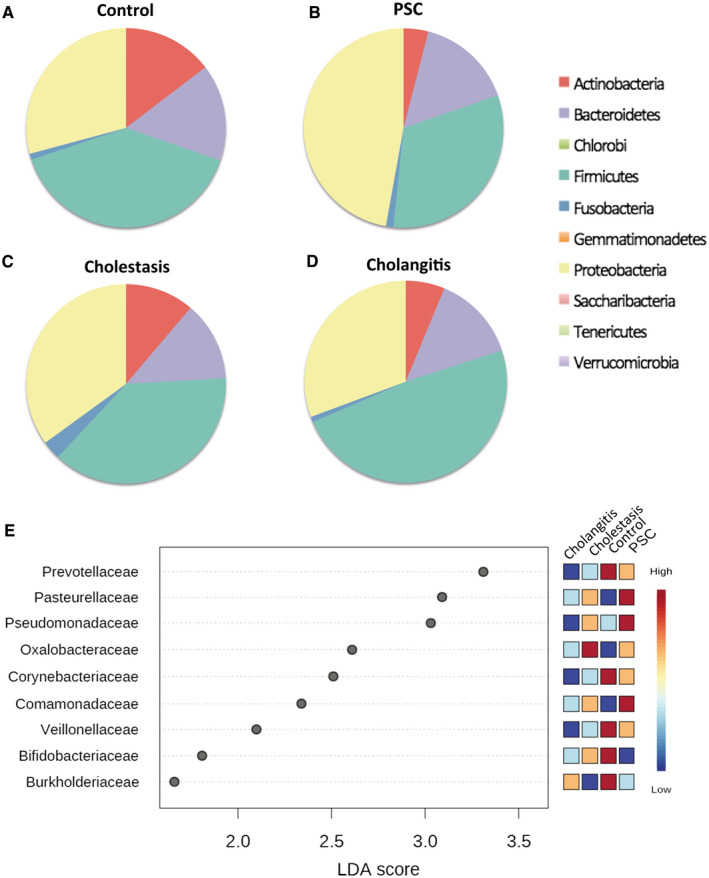
Pie charts representing the microbiota composition (relative abundance) at the phylum level from (A) the control bile samples (n = 3), (B) patients with PSC (n = 5), (C) patients with cholestasis (n = 6), and (D) patients with cholangitis (n = 5). (E) Heatmaps of the LEfSe analysis results (at the family level) of the bile microbiome.