. 2021 Sep 24;129(9):095001. doi: 10.1289/EHP9321

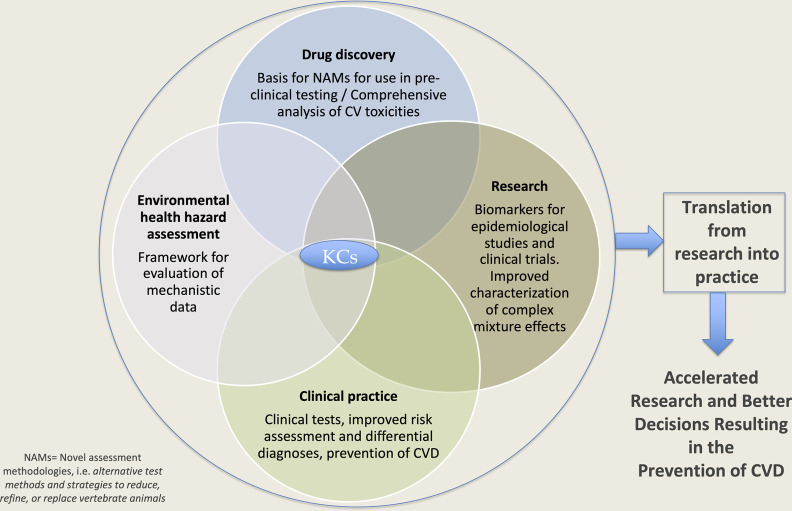
Figure 1.

Figure 1 is a flow chart titled Key Characteristics comprising a Venn diagram. The Venn diagram has four circles, namely, Drug discovery; Basis for novel assessment methodologies for use in pre-clinical testing per comprehensive analysis of Cardiovascular toxicities; Research; Biomarkers for epidemiological studied and clinical trials. Improved characterization of complex mixture effects; Clinical practice; Clinical tests, improved risk assessment and differential diagnosis, prevention of cardiovascular disease; and Environmental health hazard assessment, Framework for evaluation of mechanistic data, interconnected to each other. The center of the Venn diagram is labeled key characteristics. The Venn diagram then leads to translation from research into practice. The translation from research into practice leads to Accelerated research and better decisions resulting in the prevention of cardiovascular disease.

Utility of the key characteristics (KCs) of cardiovascular toxicants in research, drug discovery, hazard assessment, and clinical practice. An illustration of how the KCs could be used in different areas and how translation of the resulting information could lead to accelerated research, inform better regulatory decisions, improve clinical practice, and ultimately prevent CVD. Note: CV, cardiovascular; CVD, cardiovascular disease; NAM, novel assessment methodologies.