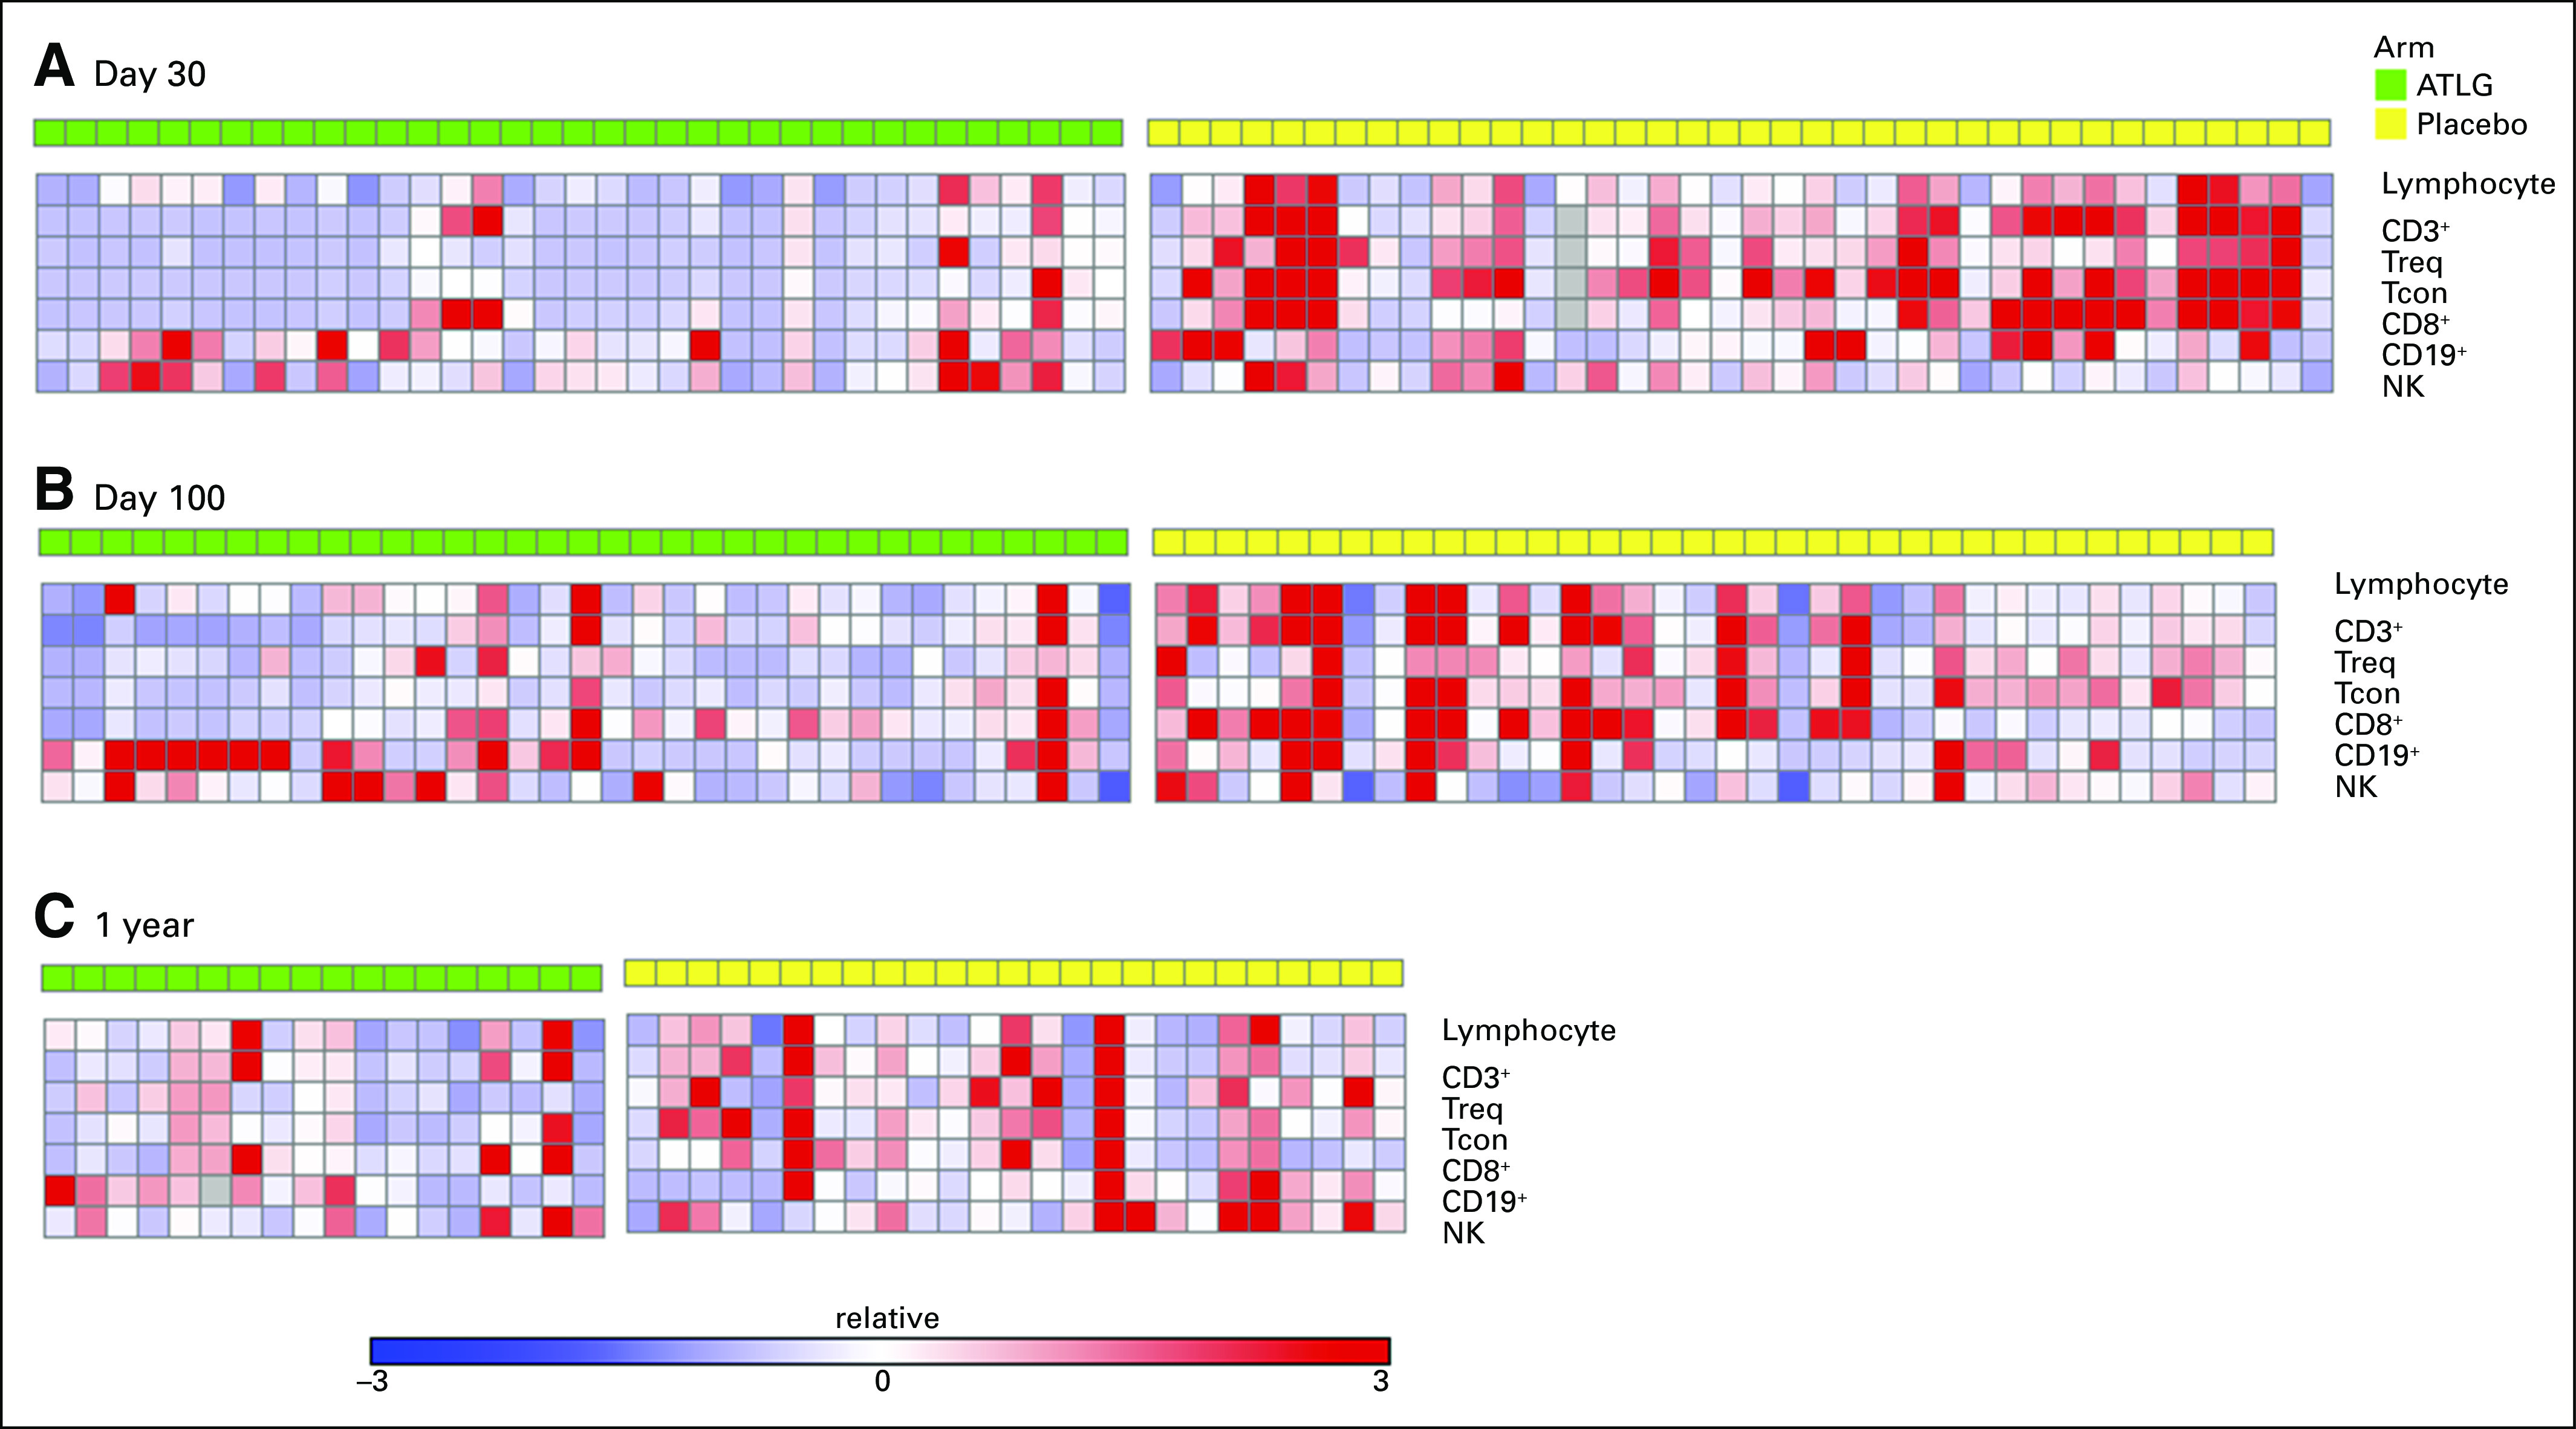
Fig A5.

Heat map of T-cell reconstitution. (A) Day 30. (B) Day 100. (C) One year. All values are absolute counts and normalized by subtracting by row median and divided by row median absolute deviation. Each column represents a single patient sample. Red indicates higher absolute counts. ATLG, anti–T-lymphocyte globulin.
