
Figure 2. EWS-FLI1 Directly Binds to and Activates ATF4.
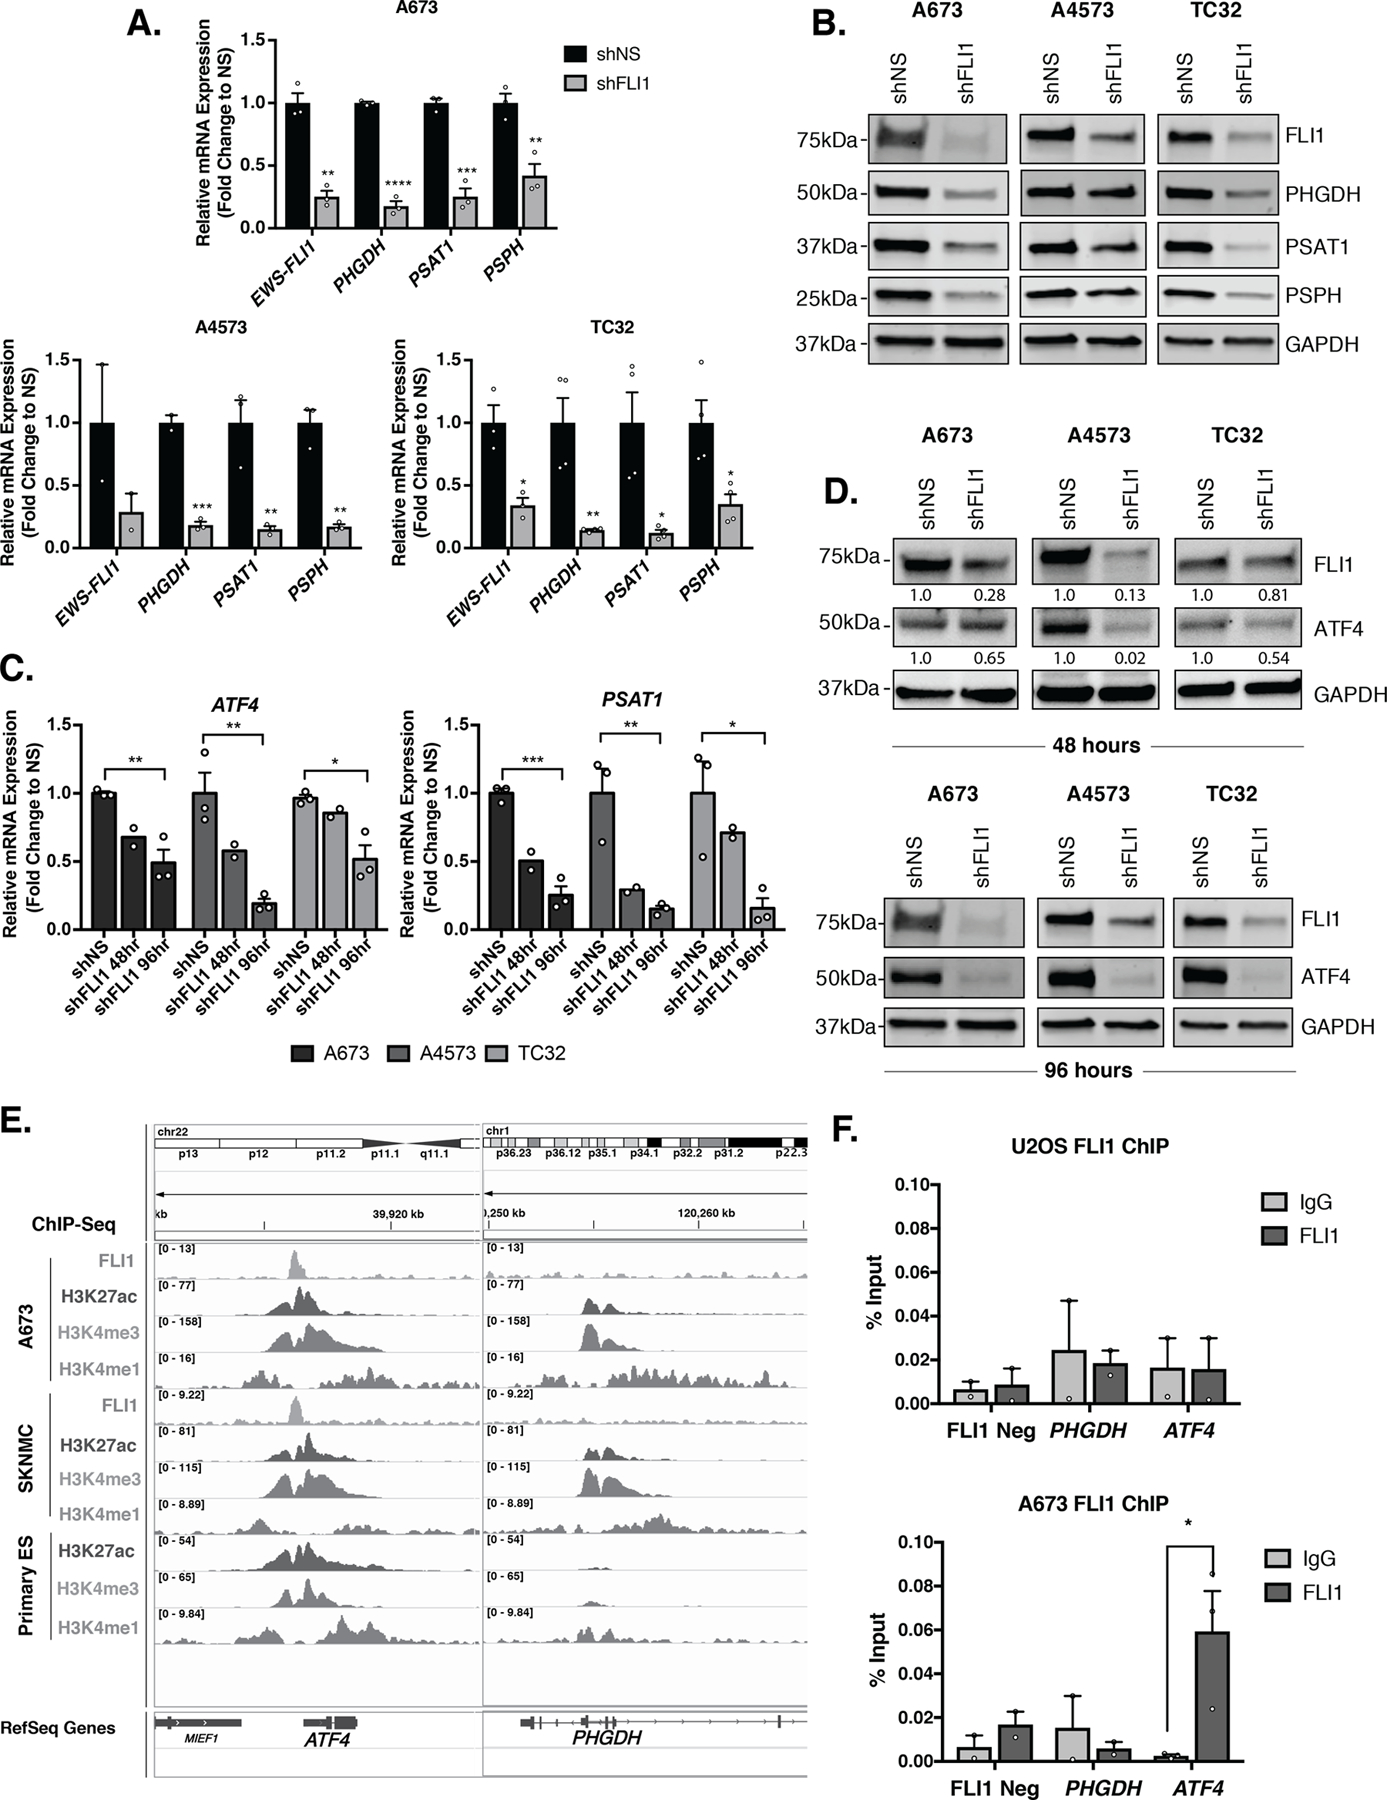
A, qRT-PCR and B, representative western blot (30 µg) for FLI1 (EWS-FLI1), and SSP (PHGDH, PSAT1, and PSPH) mRNA and protein levels after 96 hours of EWS-FLI1 knockdown (N=3, N=4). C, qRT-PCR for ATF4 and PSAT1 mRNA at 48 (N=2) and 96 (N=3) hours post-shFLI1 knockdown in A673, A4573, and TC32 cells. D, Representative western blot (30 µg) for FLI1 (EWS-FLI1) and ATF4 protein levels after 48 and 96 hours of FLI1 (EWS-FLI1) knockdown (N=3). Western blots depicted for FLI1 and GAPDH are the same as those presented in panel B and are reproduced here for ease of comparison. E, Integrative Genomics Viewer (IGV) screenshot of publicly available ChIP-seq tracks for FLI1 (EWS-FLI1), H3K27Ac, and H3K4me3 at the ATF4 and PHGDH gene promoters in Ewing sarcoma cell lines and primary tumors [8]. F, ChIP-qPCR for FLI1 (EWS-FLI1) at the PHGDH and ATF4 gene promoters (N=3). Negative control is a region in chr2 without EWS-FLI1 binding. Error bars represent SEM from independent biological replicates. * p<0.05; ** p<0.01; *** p<0.001; **** p<0.0001; Two-tailed t-test.