
Figure 4. Menin Inhibition Downregulates ATF4 Expression in an H3K4me3-Independent Manner.
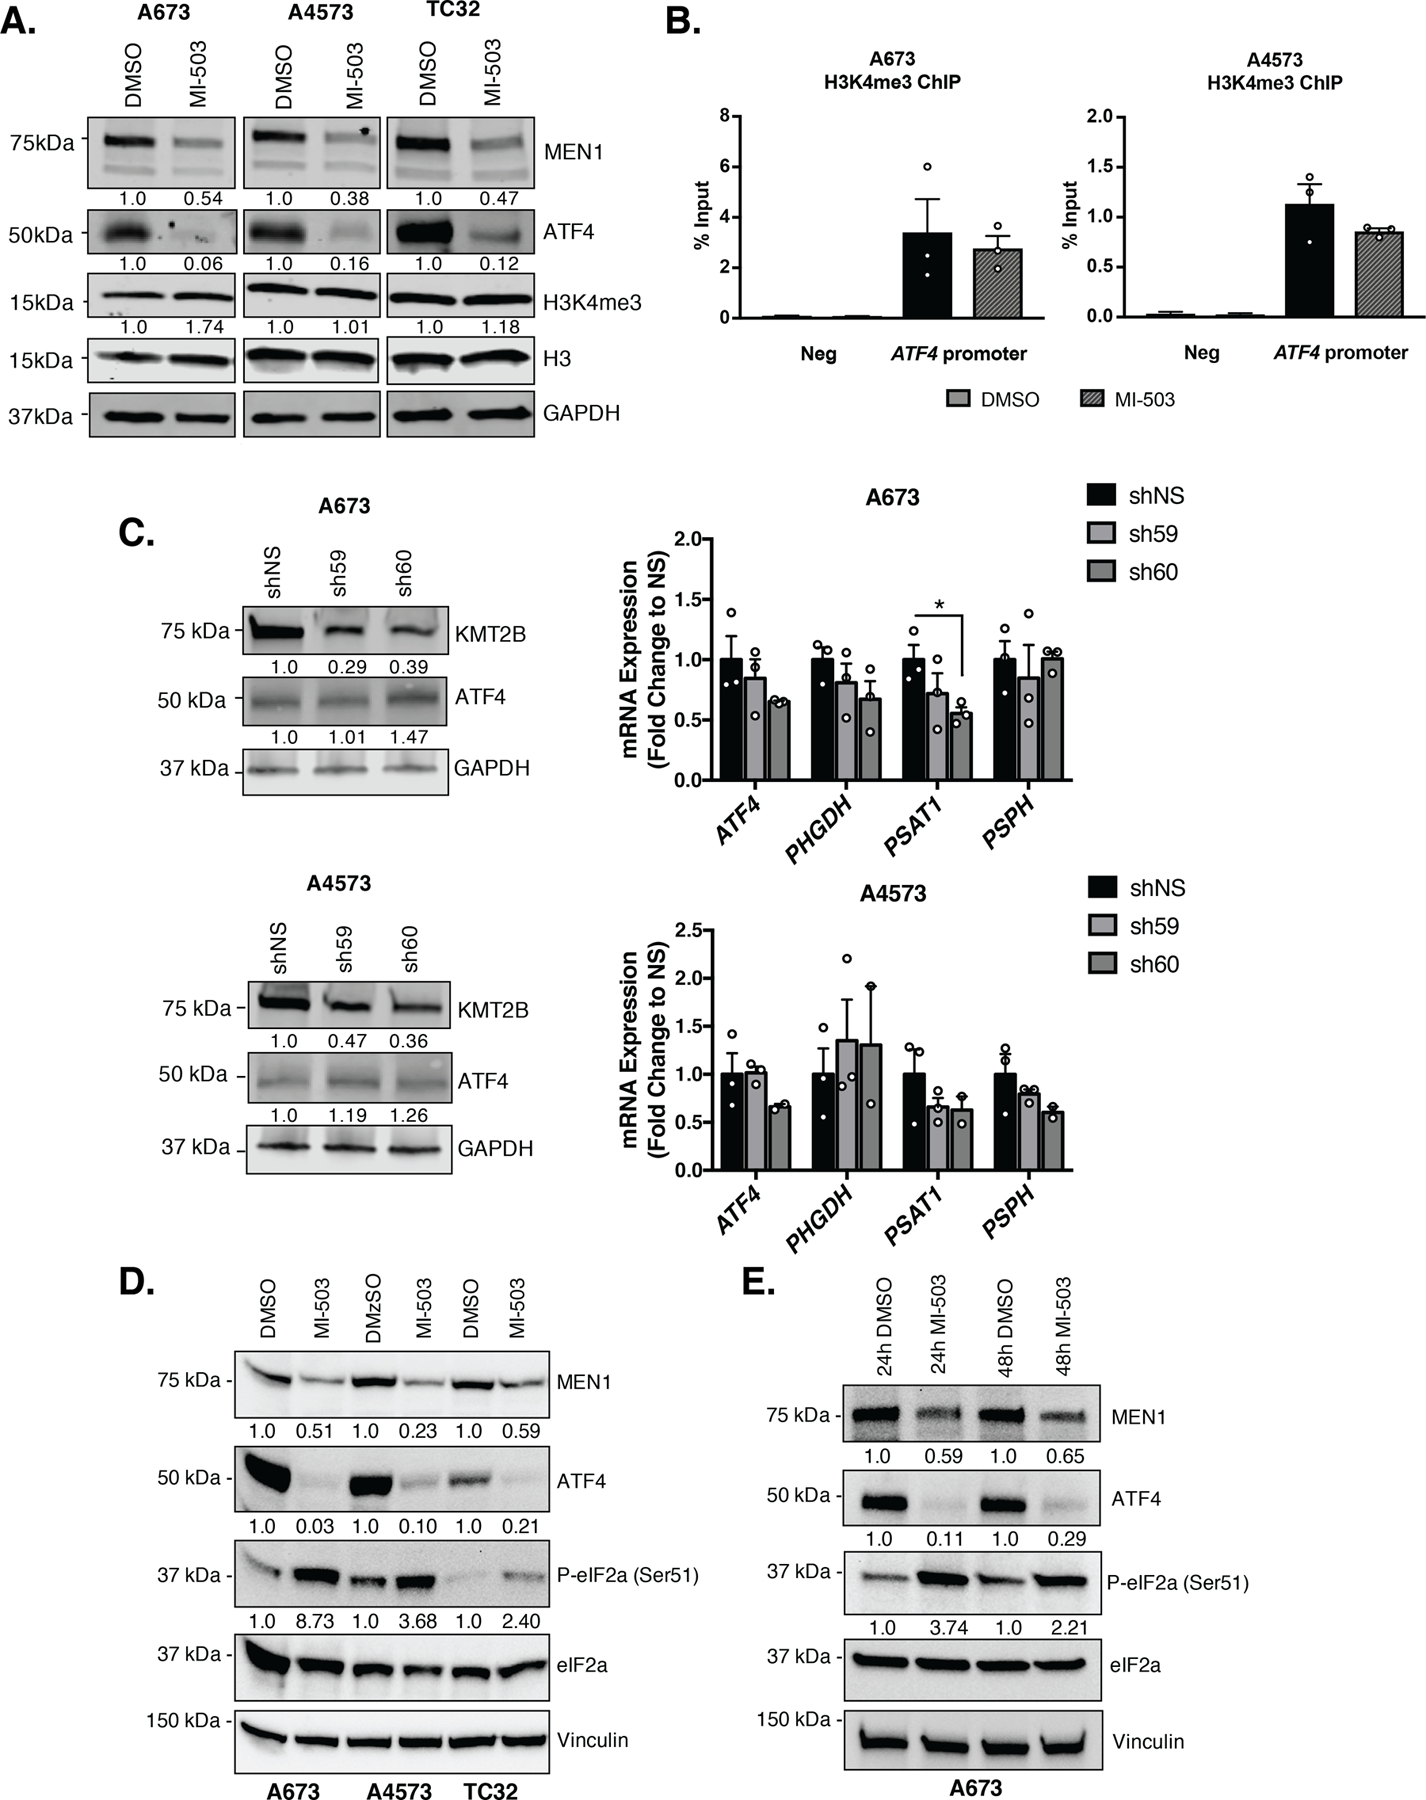
A, Representative western blot (A673 & A4573– 30 µg, TC32– 50 µg) of MEN1, ATF4, H3K4me3 and total H3 levels after 96 hours of treatment with 3 µM MI-503 or DMSO control. B, ChIP-qPCR for H3K4me3 enrichment at the ATF4 gene promoter after 96 hours of MI-503 treatment compared to DMSO control. Negative control is a gene desert region in chr2 without H3K4me3 enrichment (N=3). C, Representative western blot of MLL2 (KMT2B), MEN1, and ATF4 protein after knockdown of MLL2, and qRT-PCR for ATF4 and SSP (PHGDH, PSAT1, PSPH) mRNA after KMT2B knockdown (N=3). D, Representative western blot for MEN1, ATF4, phosphorylated-eIF2a (Ser51) and total eIF2a after 96 hours of 3 µM MI-503 treatment in A673, A4573, and TC32 cells (N=3). E, Representative western blot for P-eIF2a (Ser51) and total eIF2a after 24 and 48 hours of 3 µM MI-503 treatment in A673 cells (N=2). Error bars represent SEM from independent biological replicates. * p<0.05; Two-tailed t-test.