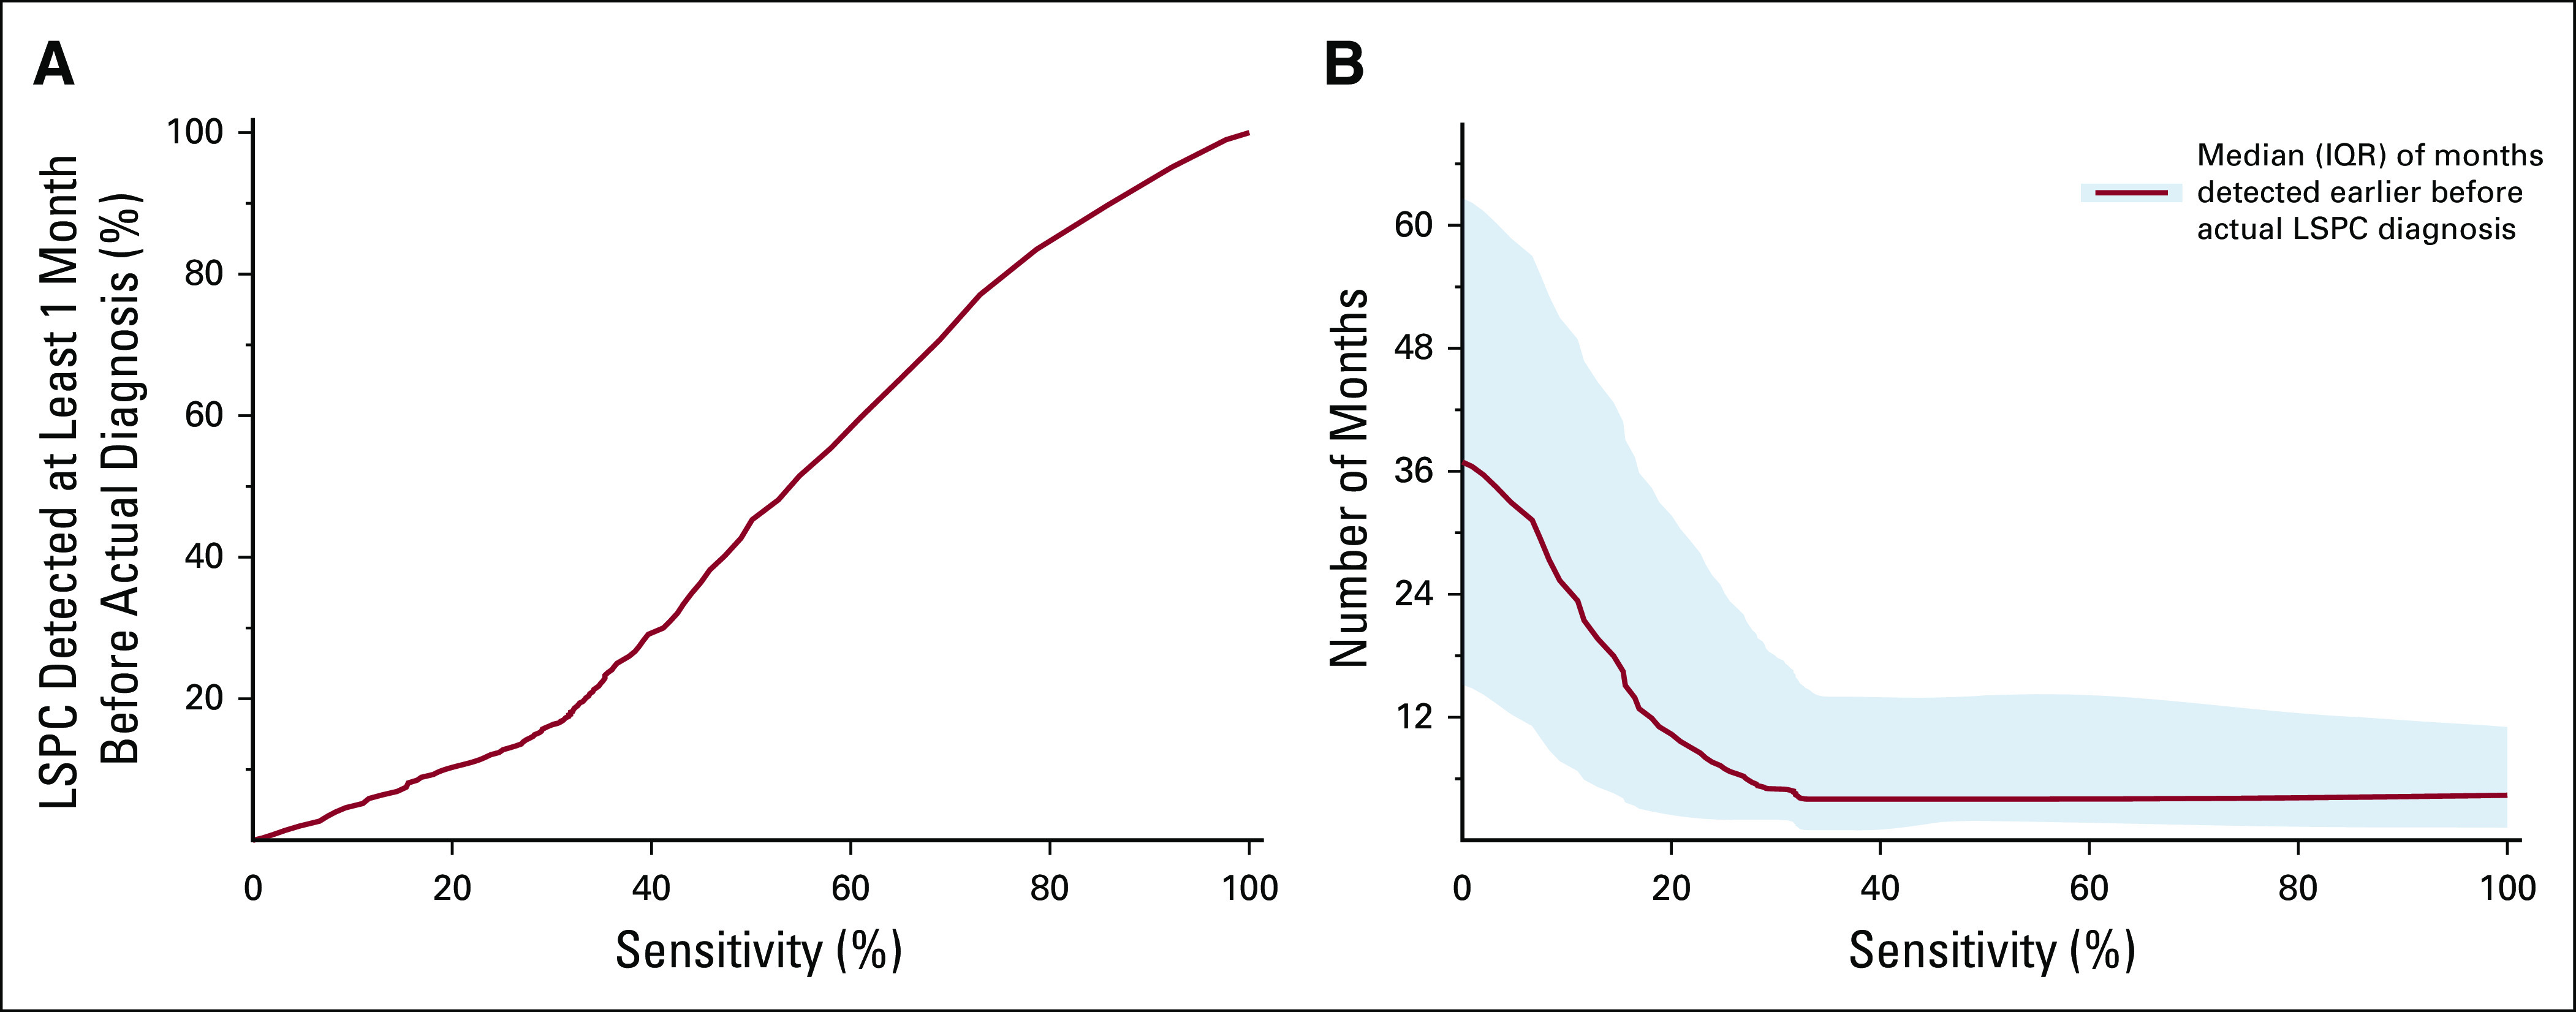
FIG 4.

Model prediction among patients with LSPC. (A) The correlation between the fraction of patients with LSPC detected and model sensitivity. (B) The correlation between the number of months that late-stage patients were detected earlier than their diagnosis, with the solid red line representing the median value and the shaded region representing the IQR. IQR, interquartile range; LSPC, late-stage pancreatic cancer.
