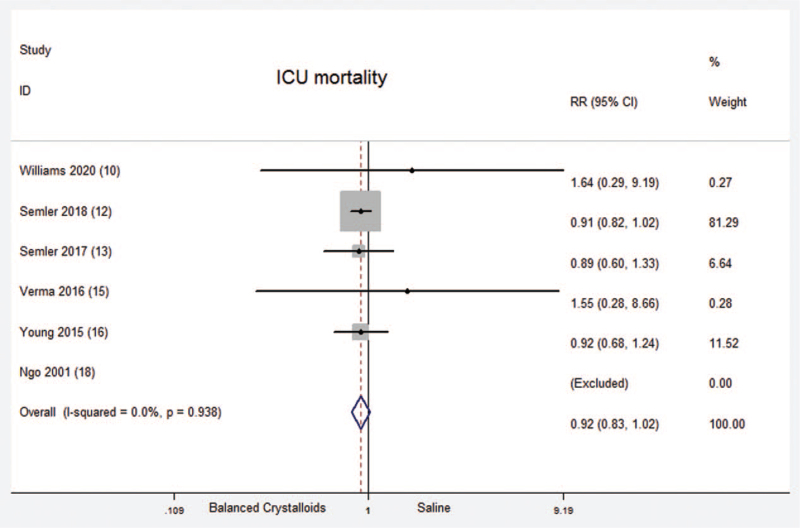
Figure 4.
ICU mortality. Forest plot showing the comparison of the balanced crystalloids group vs. saline group. The size of each square represents the proportion of information provided by each study. The vertical line depicts the point of “no difference” between the two groups, and the horizontal lines correspond to the 95% confidence intervals (CIs). Diamonds represent the RR for all studies.

