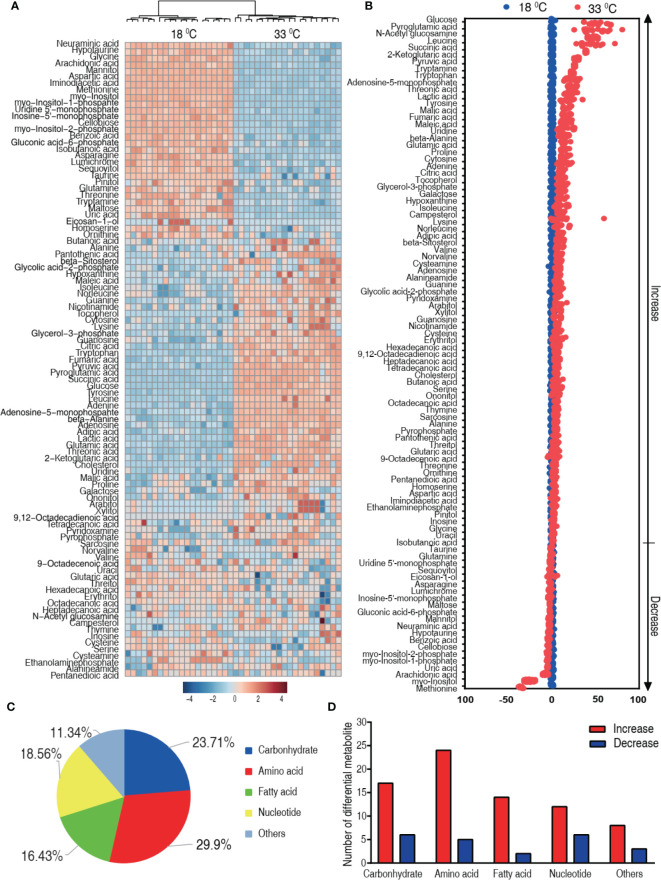
Figure 3.
Differential metabolic profiles of tilapias cultured at different temperatures. (A) Heat map showing 97 differential metabolites. Red and blue indicate increase and decrease of metabolites relative to the median metabolite level, respectively (see color scale). (B) Z-score plot of differential metabolites based on the 18°C group. Each point represents one metabolite in one technical repeat and colored by sample types. (C) The different metabolites were classified into five categories, carbohydrate (23.71%), amino acid (29.9%), nucleotide (16.43%), fatty acid (18.56%), and others (11.34%). (D) Number of increased and decreased metabolites in these categories (C), 17 and 6 (carbohydrate), 24 and 5 (amino acid), 14 and 2 (nucleotide), 12 and 6 (fatty acid), and 8 and 3 (others), respectively.

