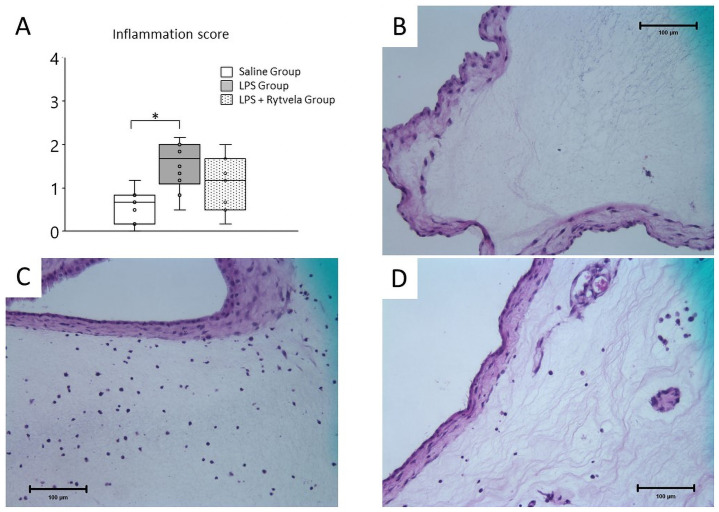
Fig 7. Histological assessment of chorioamnion.
A, Plots show median, 25th, and 75th percentile ranges as boxes and 5th to 95th percentiles as error bars. The LPS Group increased inflammation score in chorion-amnion tissue relative to the Saline Group. *p < .05 between the Saline Group and the LPS Group. Representative sections of tissue from B, Saline Group (score = 0); C, LPS Group (score = 2); D, LPS + rytvela Group (score = 1). Scale bar: 100 μm. n = 7–10 animals/group. LPS, lipopolysaccharide.

