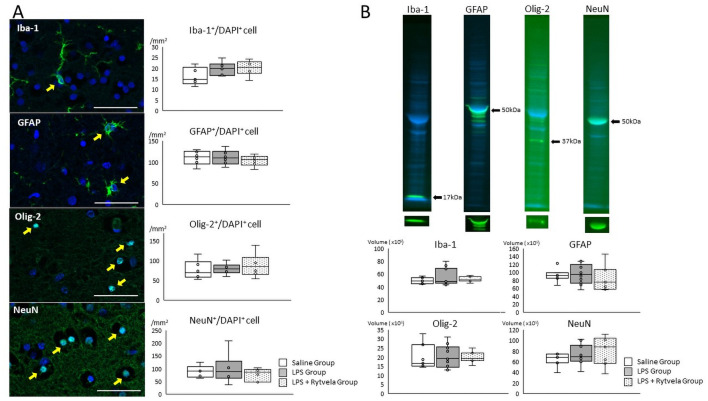
Fig 8. Fluorescent immunohistochemistry and western blotting assessment of fetal brain.
A, Representative photomicrographs show Iba-1-, GFAP-, Olig-2- and NeuN- positive (green) / DAPI positive (blue) cells in subcortical white matter of the Saline Group animals. Positive cells are indicated by arrows. Scale bar: 50 μm. Box plots show the numbers of counting Iba-1-, GFAP-, Olig-2- and NeuN- positive / DAPI positive cells of three groups. B, Representative images show Iba-1, GFAP, Olig-2 and NeuN specific band (green) and total protein stained band (blue) of the quality control animal (Saline Group animal). Box plot show the band volume of the each antibody against the total protein amounts. Plots show median, 25th, and 75th percentile ranges as boxes and 5th to 95th percentile as error bars. n = 6–8 animals/group. Iba-1, ionized calcium-binding adapter molecule 1; GFAP, glial fibrillary acidic protein; Olig-2, oligodendrocyte transcription factor 2; NeuN, neuronal nuclei.

