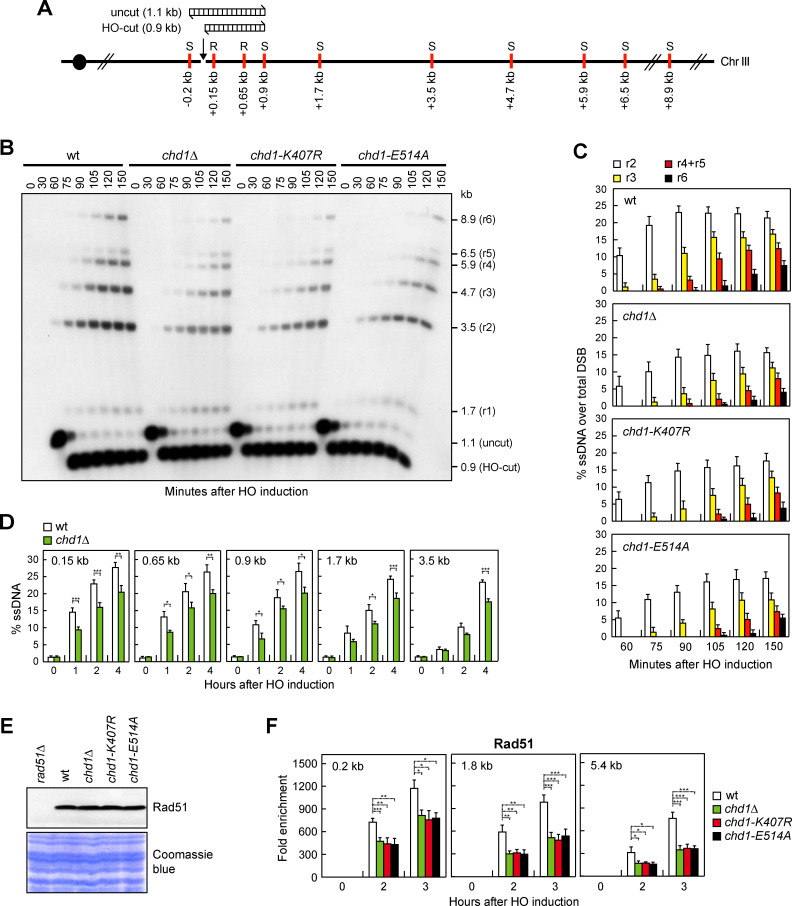
Fig 2. Chd1 dysfunction reduces DSB resection.
(A) Schematic representation of the MAT locus and the distance of RsaI (R) and SspI (S) restriction sites from the HO-cut site. The DNA fragments detected in panel B before (uncut) and after HO cleavage (HO-cut) were also indicated. (B) YEPR exponentially growing cell cultures of JKM139 derivative strains were transferred to YEPRG at time zero. Southern blot analysis of SspI-digested genomic DNA after alkaline gel electrophoresis with a probe that anneals to the unresected strand. 5’-3’ resection progressively eliminates SspI sites (S), producing SspI fragments (r1 through r6) detected by the probe. (C) The experiment as in panel B has been independently repeated three times, and the mean values are represented with error bars denoting s.d. (D) Quantification of ssDNA by qPCR at the indicated distances from the HO-cut site. Plotted values are the mean values of three independent experiments, with error bars denoting s.d. ***P < 0.005, **P < 0.01, *P < 0.05, t-test. (E) Western blot with anti-Rad51 antibodies of extracts used for the ChIP analysis shown in panel F. The same amount of extracts was separated by SDS-PAGE and stained with Coomassie Blue as loading control. (F) Rad51 ChIP at the indicated distances from the HO-induced DSB. Data are expressed as fold enrichment at the HO-cut site over that at the non-cleavable ARO1 locus, after normalization to the corresponding input for each time point. Fold enrichment was normalized to cut efficiency. Plotted values are the mean values ± s.d. from three independent experiments. ***P<0.005, **P<0.01, *P<0.05, t-test.

