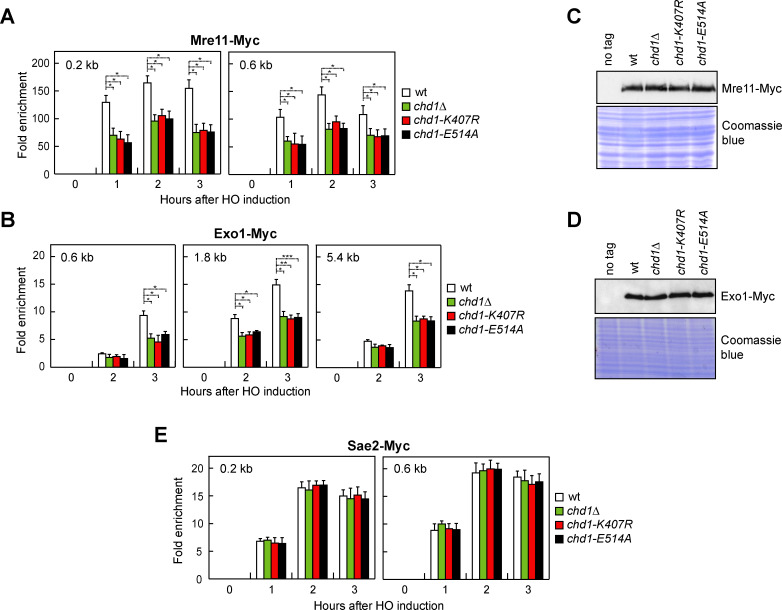
Fig 3. Chd1 dysfunction impairs MRX and Exo1 association with a DSB.
(A,B) Mre11-Myc (A) and Exo1-Myc (B) ChIP at the indicated distances from the HO-cut site. Data are expressed as fold enrichment at the HO-cut site over that at a non-cleavable locus (ARO1), after normalization to the corresponding input for each time point. Fold enrichment was normalized to cut efficiency. Plotted values are the mean values ± s.d. from three independent experiments. ***P<0.005, **P<0.01, *P<0.05, t-test. (C,D) Western blot with anti-Myc antibodies of extracts used for the ChIP analysis shown in panels A and B. (E) Sae2-Myc ChIP at the indicated distances from the HO-cut site.

