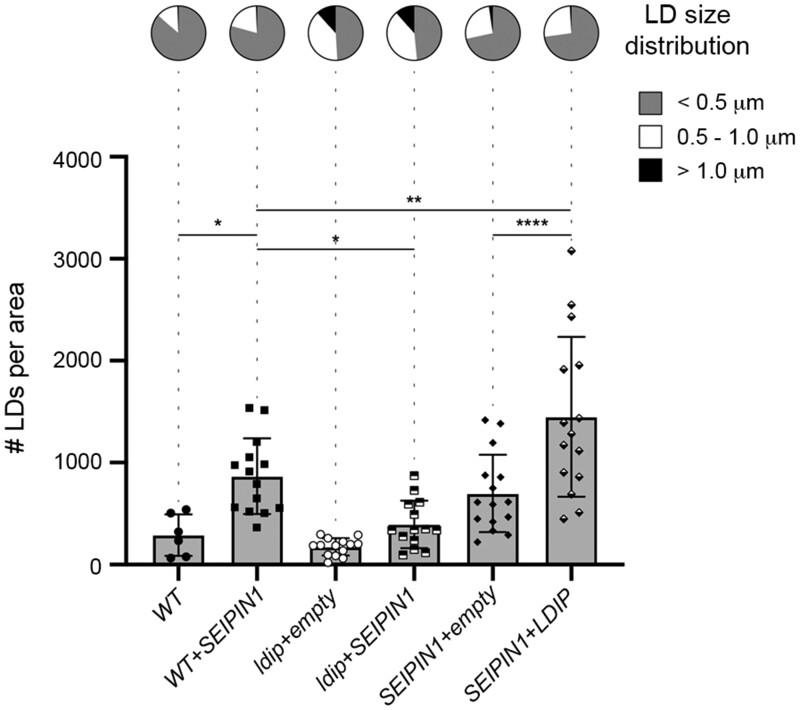
Figure 7.
Modulating the relative expression levels of LDIP and SEIPIN1 influences LD numbers and/or sizes in Arabidopsis leaves. Arabidopsis transgenic lines were generated by transforming either WT or the ldip KO or SEIPIN1 (overexpression) homozygous parental lines (previously characterized in Pyc et al. (2017a) and Cai et al. (2015), respectively) with plasmids encoding Arabidopsis SEIPIN1 or LDIP, or the corresponding empty vector serving as a control. T1 transgenic seedlings were selected on plates based on antibiotic resistance conferred by the introduced transgene-containing vector and then BODIPY-stained LDs in leaf epidermal and mesophyll cells in 28-day-old plants were visualized with CLSM. Values of LD numbers represent the mean ± sd from three biological replicates, with each replicate consisting of three micrographs of two leaf samples from five individual T1 plants per line, with the exception of the WT, whereby two to four plants from two replicates were examined. LD diameters were calculated using the same data set (i.e. micrographs) and are presented as the distribution of LDs in three size classes: <0.5 µm (small), 0.5–1.0 µm (intermediate), and >1.0 µm (large); refer also to key. *P ≤0.05, **P ≤0.01, or ****P ≤0.0001 in graph represent statistically significant differences as determined by an ANOVA test followed by a Šídák’s post hoc multiple comparisons test. A summary of the statistical analysis is shown in Supplemental Data Set S1. Refer to Supplemental Figure S2H for RT-PCR analysis confirming the relative overexpression or absence of (trans)gene expression for LDIP and SEIPIN1 in selected T1 transgenic seedlings compared to the WT. See also Supplemental Figure S1C for violin plots representing the average LD sizes (i.e. LD diameters) in the same lines, based on the data set used here in Figure 7.

