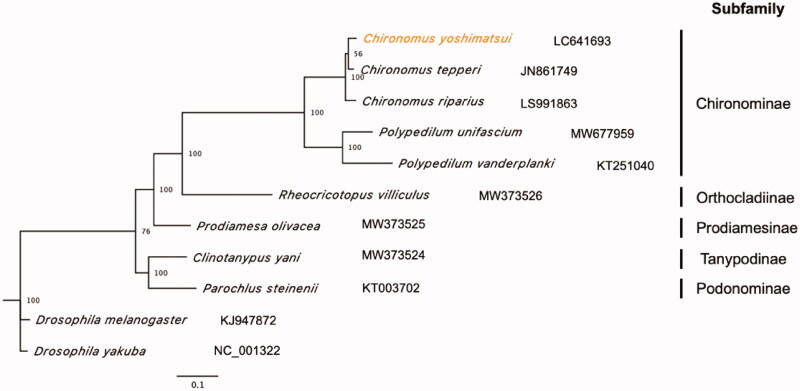
Figure 1.
Maximum likelihood tree based on 13 PCGs and 2 rRNAs in mitochondrial genomes of Chironomidae family. Orange represents the genome obtained in this study. Drosophila melanogaster and D. yakuba were used as the outgroup. Non-parametric bootstrap values (based on 3,000 times resampling) are shown at nodes. The scale bar indicates the number of amino acid substitutions per site.

