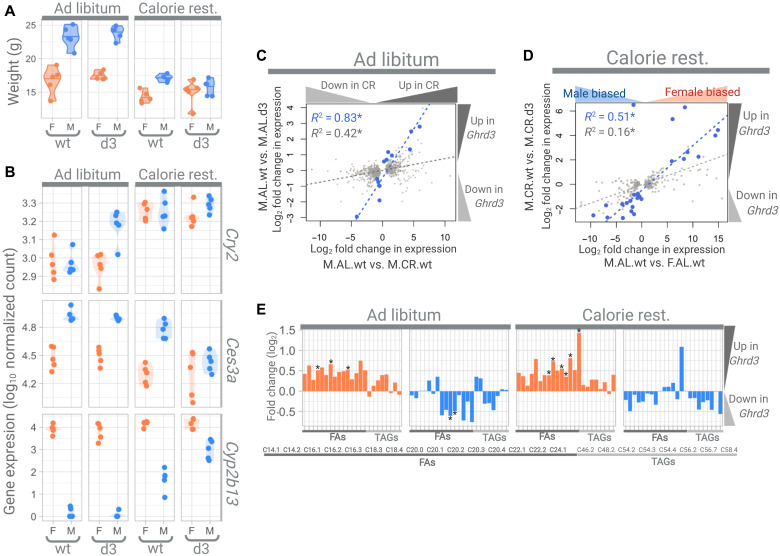
Fig. 4. The phenotypic effects of Ghrd3.
(A) Weights of mice. Female and male mice are labeled by orange and blue, respectively. (B) Examples of genes that show significant differences between wt/wt and d3/d3 male mice. Cry2 is an example of a circadian gene, while Cyp2b13 and Ces3a are examples of genes with sex-specific expression. (C) Correlation between the effect of calorie restriction (x axis) and Ghrd3 under an AL diet (y axis). The light gray dots show the genes that have significantly (Padj < 0.01) different expression levels between wt/wt male mice that were fed AL and CR diets. The blue dots show the genes that have significantly (Padj < 0.01) different expression levels between wt/wt and d3/d3 male mice that were grown under AL diets. (D) Correlation between the effect of sex (x axis) and Ghrd3 under calorie restriction (y axis). The light gray dots show the genes that have significantly (Padj < 0.01) different expression levels between males and females, while blue dots show the genes that have significantly (Padj < 0.01) different expression levels between wt/wt and d3/d3 male mice that were grown under a CR diet. (E) Log2 fold changes between wt/wt and d3/d3 mice for FA (fatty acid) and TAG (triacylglyceride) levels in the blood serum. Asterisk indicates significant changes (nominal P < 0.05, t test).

