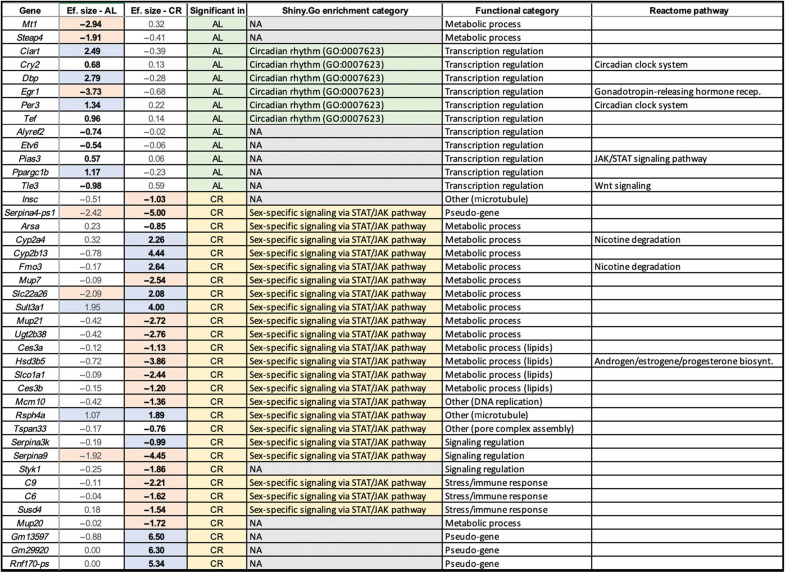
Table 1. The effect sizes of genes that show significant expression level differences between wt/wt and d3/d3 male mice under AL and CR conditions.
The orange and blue colors indicate genes that are up-regulated or down-regulated more than twofold in d3/d3 mice compared to wt/wt mice, respectively. The fold changes that are shown to be significant (Padj < 0.01) are bolded. The top enrichment classifications in Shiny.Go (more detailed information can be found in table S4), manually curated Panther classifications, and Reactome pathway classifications, respectively, are in the last three columns. NA, not available.

