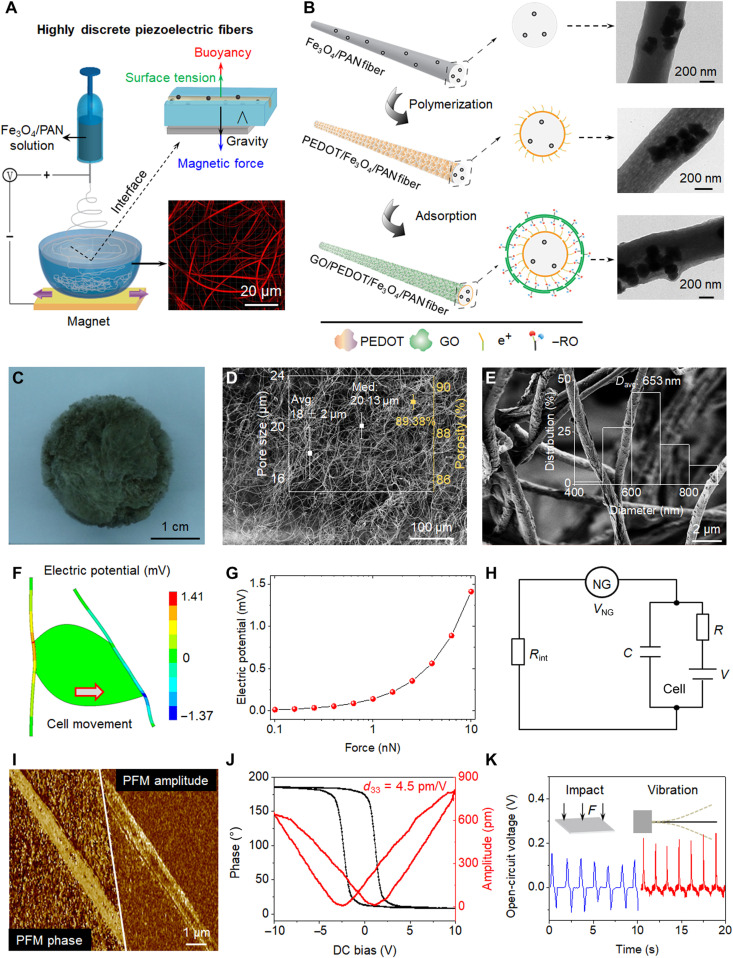
Fig. 2. Schematic representation and piezoelectric analysis of bio-NGs.
(A) Schematic diagram of the fabrication of highly discrete piezoelectric Fe3O4/PAN fibers. With the help of the neodymium iron boron magnet, Fe3O4 magnetic nanoparticles were introduced into PAN electrospun solution to break through the surface tension of water. (B) The PEDOT conductive layer was loaded with the method of in situ polymerization; GO nanosheets were adsorbed on the outermost layer of fibers by the contribution of electrostatic adsorption force to form the target GO/PEDOT/Fe3O4/PAN fibers. Transmission electron microscopy images of the single fiber obtained in every step. (C to E) Optical image and scanning electron microscopy (SEM) images of the bio-NGs. The inset of (D) shows pore size distribution and porosity. The inset of (E) shows the fiber diameter distribution range of the GO/PEDOT/Fe3O4/PAN fibers. (F) Finite element analysis simulation of piezoelectric fibers coupled with a living cell generating a maximum voltage of 141 mV when strained by a tangential force of 10 nN. (G) Piezoelectric potential generated by a single fiber as a function of the applied tangential cell force. (H) Simplified resistor-capacitor circuit created by the NG, the NG-cell interface, and the cell membrane. (I) Piezoelectric force microscopy (PFM) phase and PFM amplitude images of a single fiber in bio-NGs. (J) Phase-electric potential hysteresis and butterfly amplitude loops of fibers in bio-NGs, obtained with a DC voltage varying from −10 to 10 V. (K) Voltage outputs from the bio-NGs under the same impact force of 1 N (blue) and under a vibration at 0.7 Hz (red). The inset represented the impact (left) and vibration (right) methods used to characterize the fibers in bio-NGs. F, force. Photo credit: Chuanmei Shi, Nanjing University of Science and Technology.

