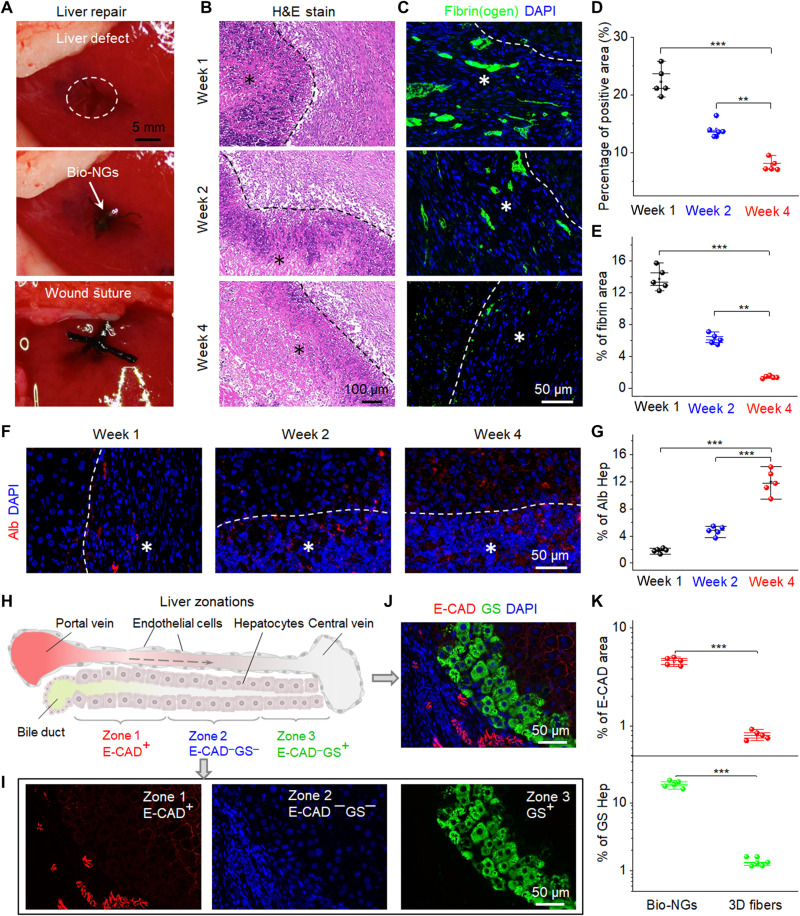
Fig. 6. Liver repair promotion by bio-NGs in vivo.
(A) Surgical images showing the implantation of the bio-NGs into the liver defect. (B) H&E staining of the liver sections at different time points (weeks 1, 2, and 4) after implantation. (C) Representative images of hepatic fibrin(ogen) immunostaining (green) in 4′,6-diamidino-2-phenylindole (DAPI) (blue)–counterstained liver sections at the implanted area. (D) Average percentage of the positive area measured from H&E staining. (E) Quantification of hepatic fibrin immunofluorescent labeling. (F) Immunostaining for Alb (red) on liver sections at different time points (weeks 1, 2, and 4) after implantation. (G) Alb expression level measured from Alb immunostaining. (H) Schematic showing three liver zones from the periportal to the pericentral region. 1, 2, and 3 indicate zone 1 (E-CAD+), zone 2 (E-CAD─GS─), and zone 3 (GS+), respectively. The dashed arrow indicates blood flow. (I and J) Immunostaining for GS (green) and E-CAD (red) on liver sections at the fourth week after implantation. (K) Quantification of GS and E-CAD showing stronger expression of liver function of new hepatocytes in bio-NGs than that of 3D fibers. Hep, hepatocyte. Asterisks (*) show locations of the implantation. Data are expressed as mean values ± SD. n = 5. **P < 0.01 and ***P < 0.001. Photo credit: Fei Jin, Nanjing University of Science and Technology.

