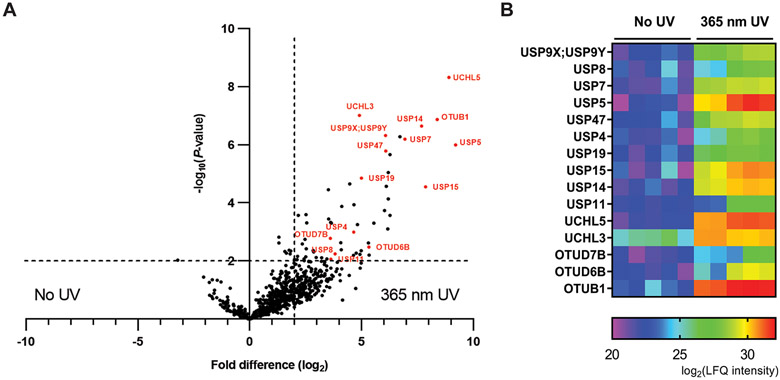
Figure 5.
Comparison of HeLa cell-based pulldown by 15 μM HA-Cys(cR10)-Ub-TZ in the presence and absence of 365 nm UV irradiation analyzed using MS-based LFQ. (A) Volcano plot of pairwise comparison of protein groups pulled down by HA-Cys(cR10)-Ub-TZ with 365 nm UV irradiation relative to no UV irradiation. Significantly enriched DUBs are colored as red and labeled. (B) Heat map representing the LFQ intensity scores of protein groups significantly enriched by HA-Cys(cR10)-Ub-TZ with 365 nm UV irradiation. Red and purple represent high and low enrichment, respectively.

