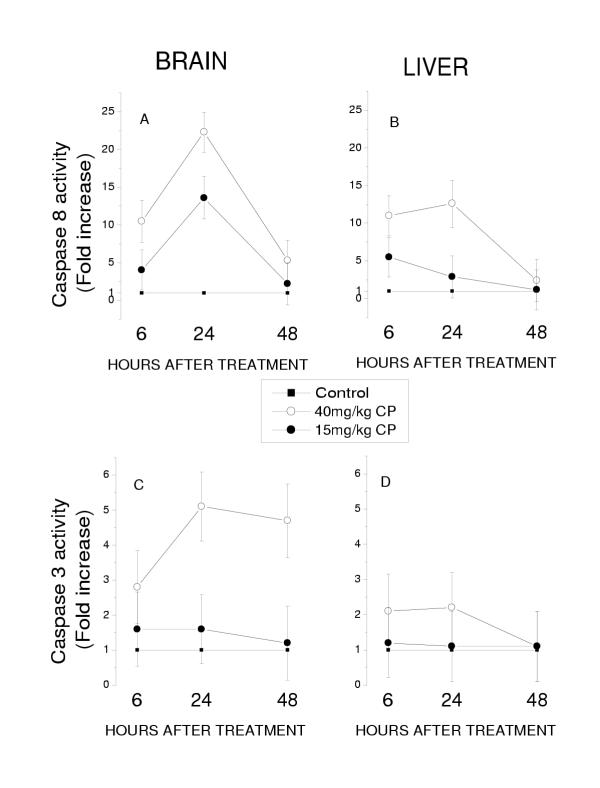
Figure 4.
Active caspase 8 and caspase 3 expression in the embryonic brain and liver of control embryos and embryos exposed to CP. Results obtained in experimental groups are presented as 95% limits for the means (fold increase) calculated by GT2-method. Means with limits that do not overlap are significantly different. Means with lower limits < 1 (the level of the activity of the caspases in controls) do not differ significantly from controls.

