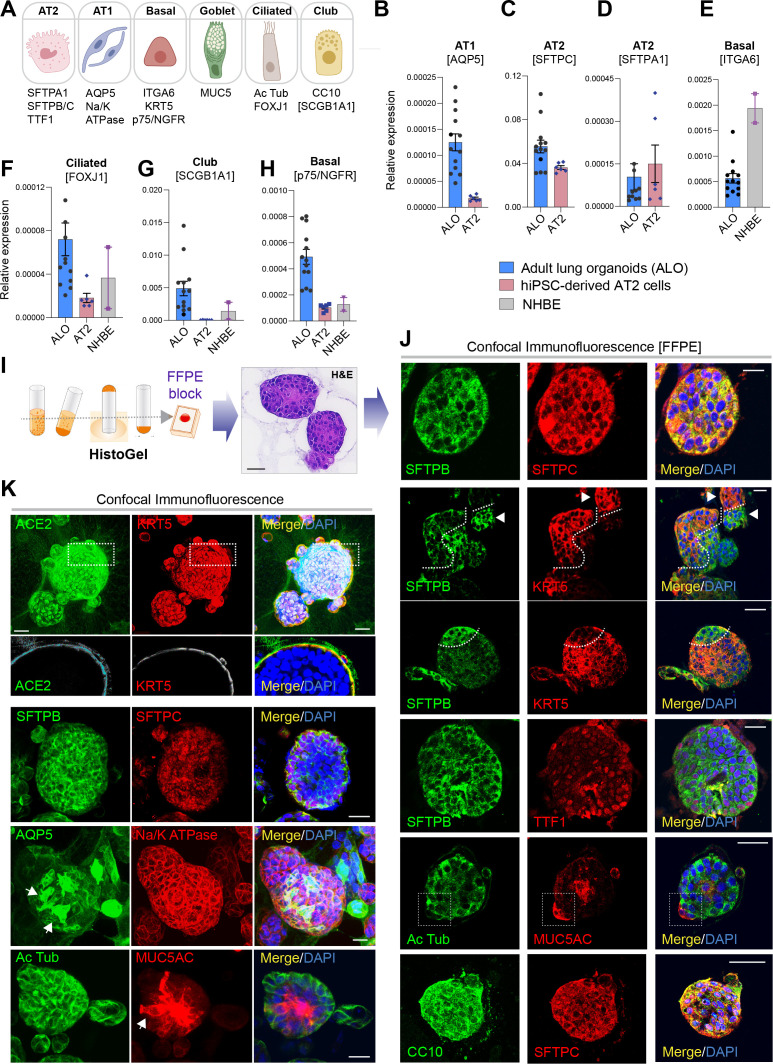
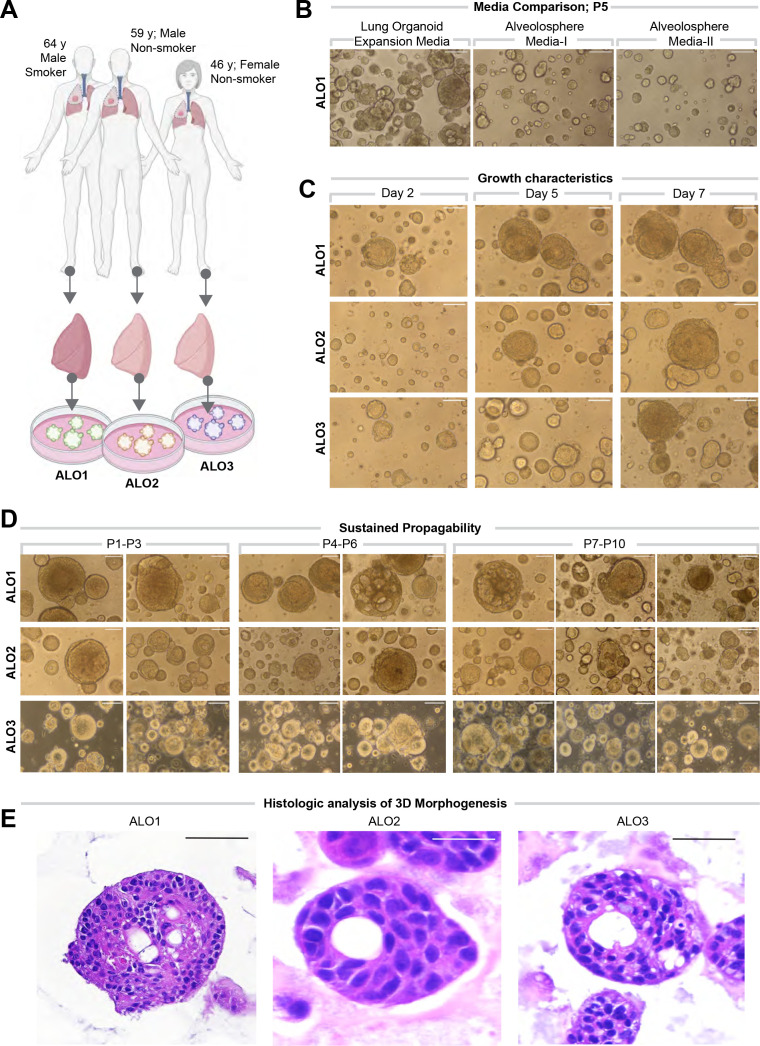
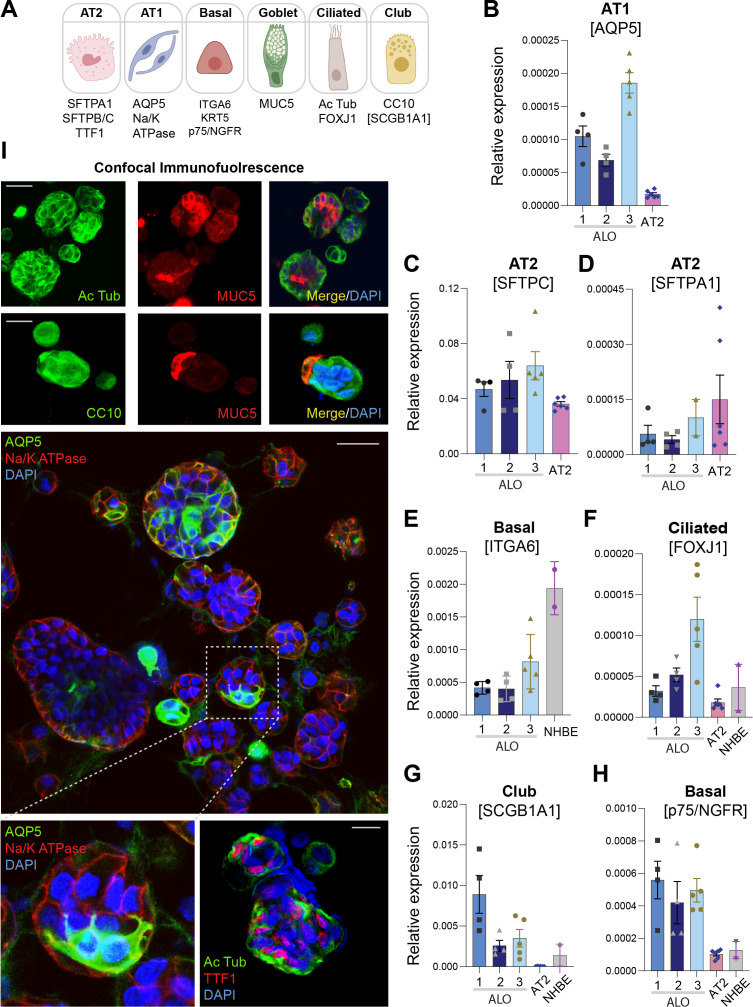
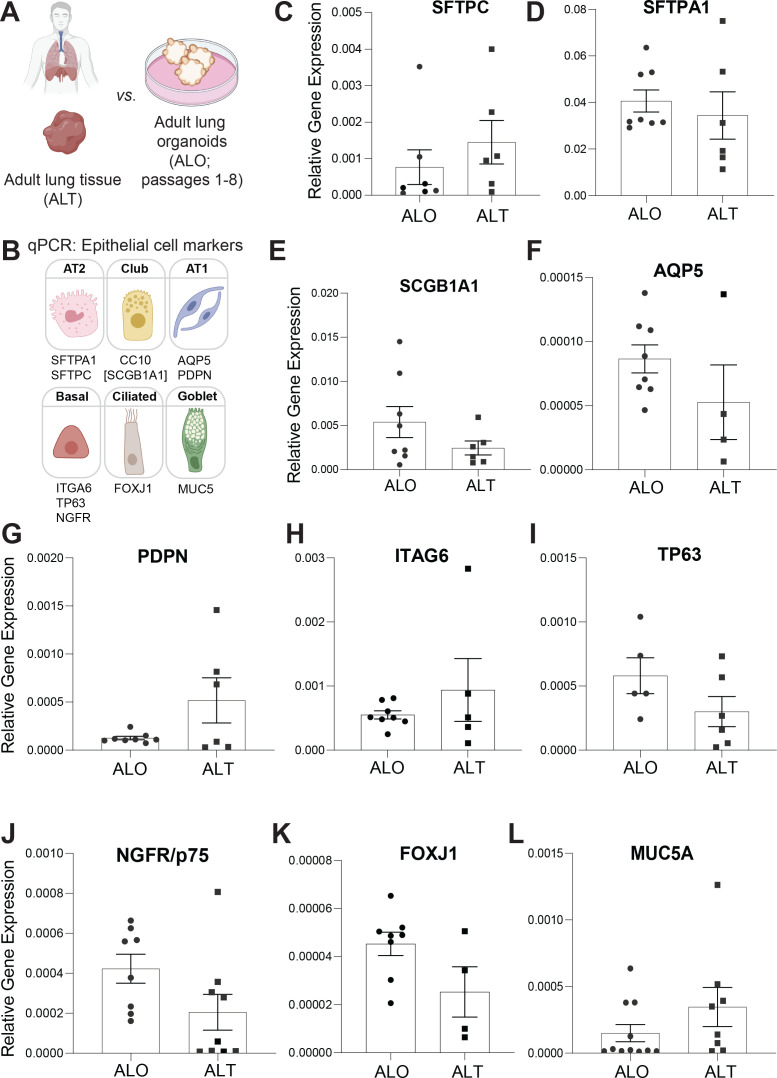
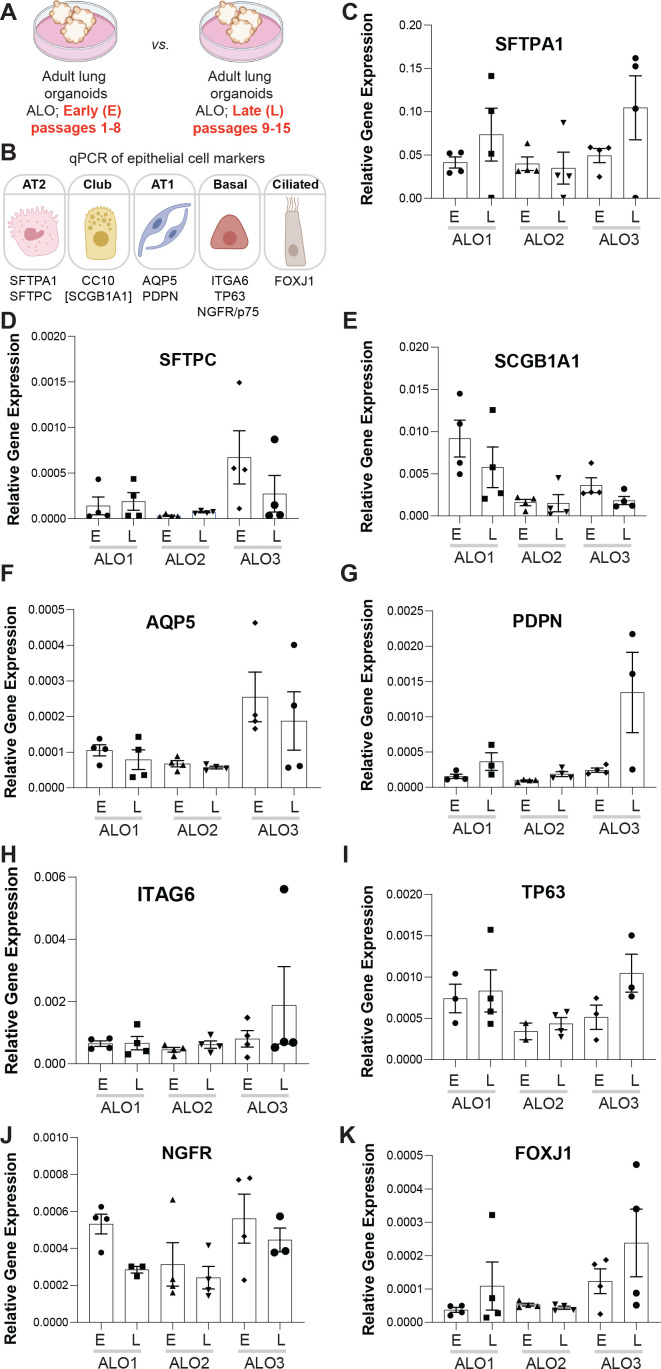
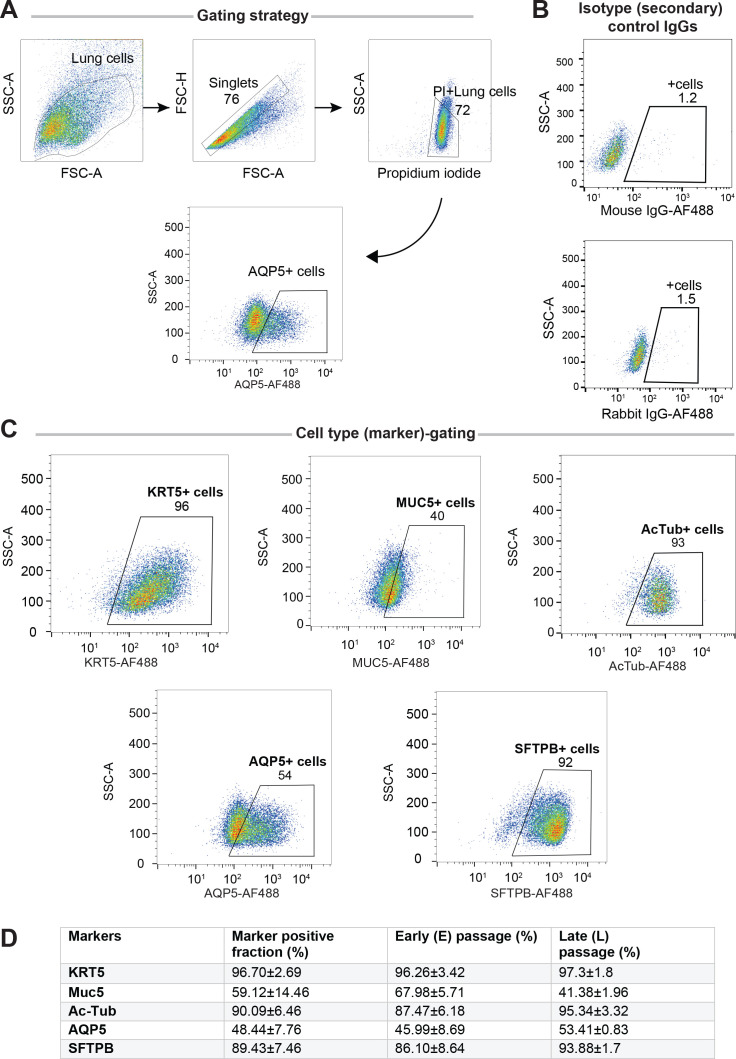
Figure 2. Adult stem cell-derived lung organoids are propagatable models with both proximal and distal airway components.
(A) Schematic lists the various markers used here for qPCR and immunofluorescence to confirm the presence of all cell types in the 3D lung organoids here and in 2D monolayers later (in Figure 3). (B–H) Bar graphs display the relative abundance of various cell-type markers (normalized to 18S) in adult lung organoids (ALO), compared to the airway ( normal human bronchial epithelial cell [NHBE]) and/or alveolar (AT2) control cells, as appropriate. p-values were analyzed by one-way ANOVA. Error bars denote SEM; n = 3–6 datasets from three independent ALOs and representing early and late passages. See also Figure 2—figure supplement 2 for individual ALOs. (I, J). H&E-stained cell blocks were prepared using HistoGel (I). Slides were stained for the indicated markers and visualized by confocal immunofluorescence microscopy. Representative images are shown in (J). Scale bar = 50 µm. (K) 3D organoids grown in 8-well chamber slides were fixed, immunostained, and visualized by confocal microscopy as in (J). Scale bar = 50 µm. See also Figure 2—figure supplement 2. Top row (ACE2/KRT5-stained organoids) displays the single and merged panels as max projections of z-stacks (top) and a single optical section (bottom) of a selected area. For the remaining rows, the single (red/green) channel images are max projections of z-stacks; however, merged panels are optical sections to visualize the centers of the organoids. All immunofluorescence images showcased in this figure were obtained from ALO lines within passage #3–6. See also Figure 2—figure supplements 3–5 for additional evidence of mixed cellularity of ALO models, their similarity to lung tissue of origin, and stability of cellular composition during early (#1–8) and late (#8–15) passages, as determined by qPCR and flow cytometry.

