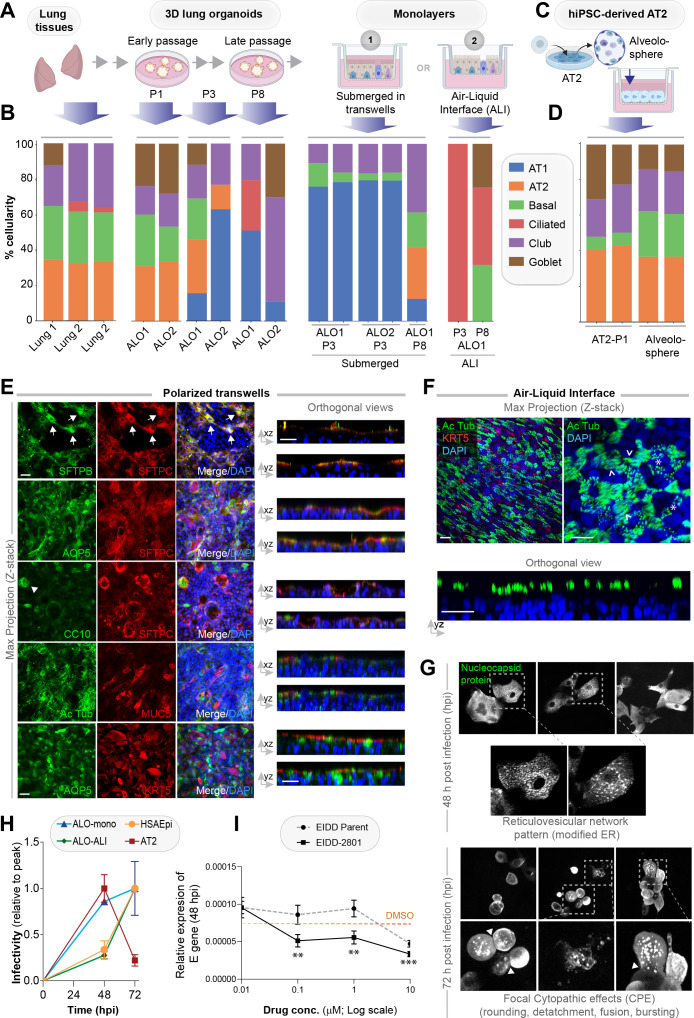
Figure 3. Monolayers derived from lung organoids differentiate into proximal and distal airway components.
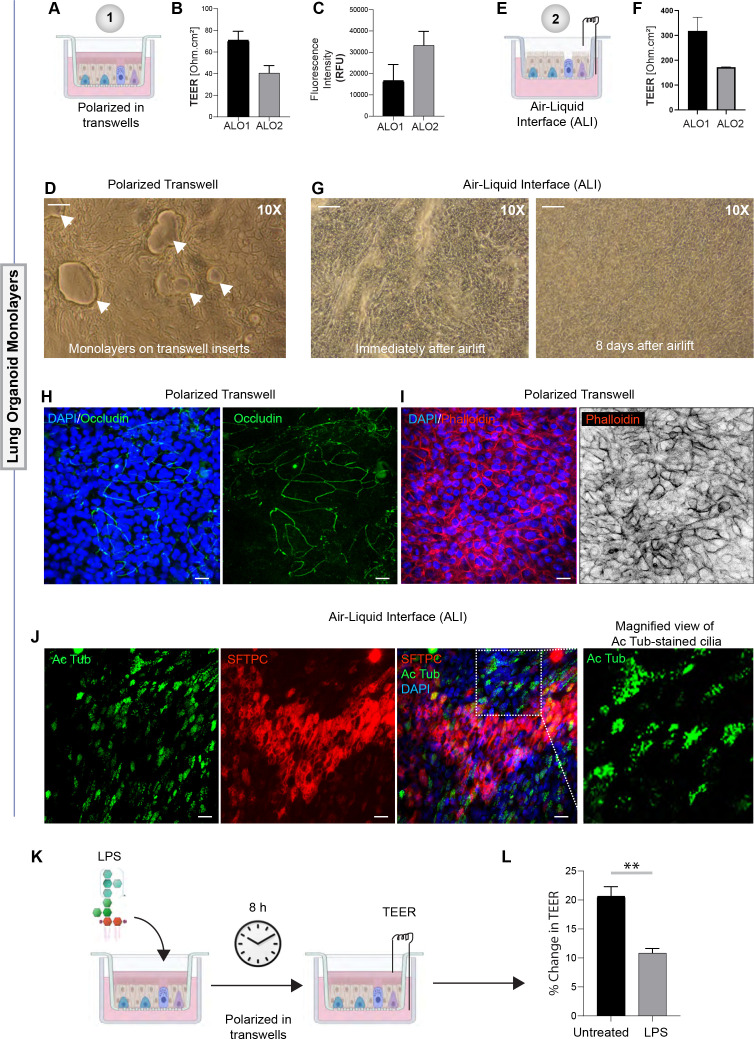
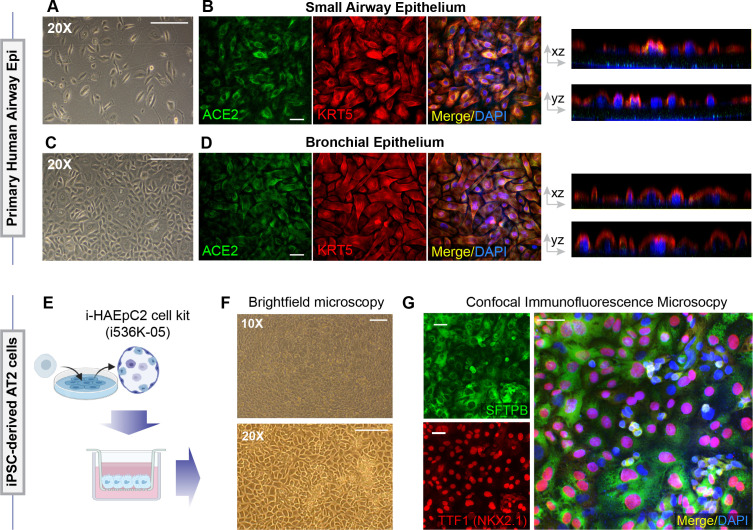
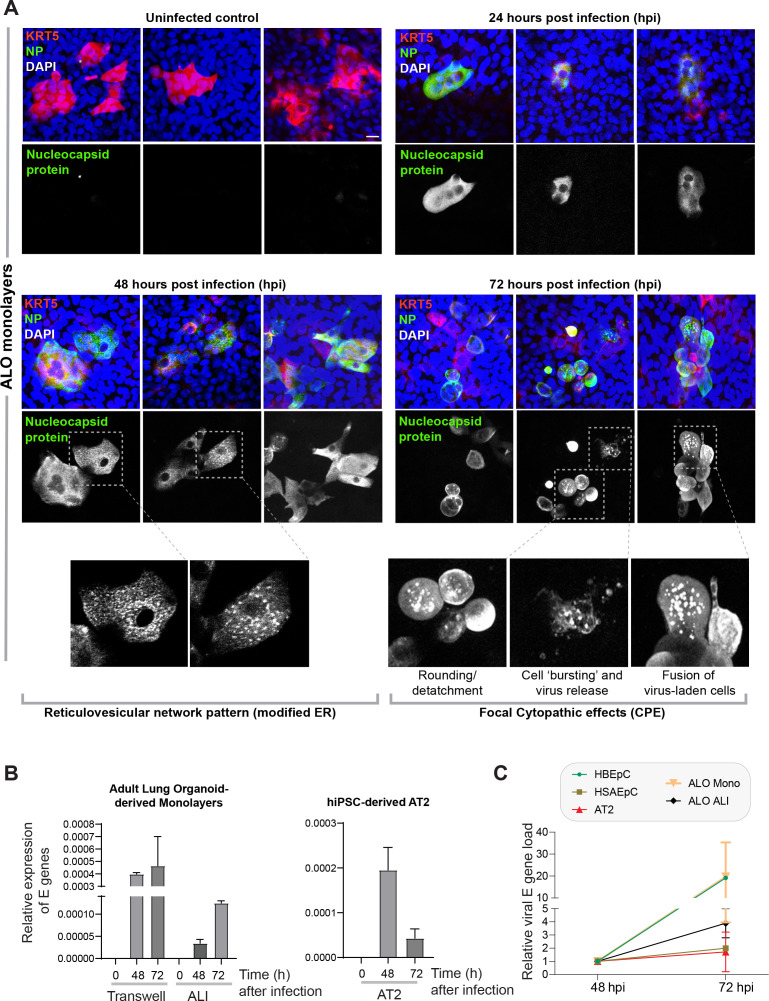
(A, B) Samples collected at various steps of lung organoid isolation and expansion in culture, and from the two types of monolayers prepared using the lung organoids were analyzed by bulk RNA seq and the datasets were compared for % cellular composition using the deconvolution method, CYBERSORTx. Schematic in (A) shows the workflow steps, and bar plots in (B) show the relative proportion of various lung cell types. (C, D) hiPSC-derived AT2 cells and alveolospheres (C) were plated as monolayers and analyzed by RNA seq. Bar plots in (D) show % cellular composition. (E, F) Submerged adult lung organoids (ALO) monolayers in transwells (E) or monolayers were grown as air-liquid interphase (ALI) models (F) were fixed and stained for the indicated markers and visualized by confocal immunofluorescence microscopy. The representative max projected z-stack images (left) and the corresponding orthogonal images (right) are displayed. Arrows in (E) indicate AT2 cells; arrowheads in (E) indicate club cells; asterisk in (F) indicates bundles of cilia standing perpendicular to the plane of the ALI monolayers; arrowheads in (F) indicate bundles of cilia running parallel to the plane of the ALI monolayers. Scale bar = 20 µm. (G) Monolayers of ALO1-3 were challenged with SARS-CoV-2 for indicated time points prior to fixation and staining for KRT5, SARS-COV2 viral nucleocapsid protein and DAPI and visualized by confocal microscopy. A montage of representative images are shown, displaying reticulovesicular network patterns and various cytopathic effects. Scale bar = 15 µm. (H) Monolayers of ALO, hiPSC-derived AT2 cells, and other alternative models (see Figure 3—figure supplements 1–2) were infected or not with SARS-CoV-2 and analyzed for infectivity by qPCR (targeted amplification of viral envelope, E gene). See also Figure 3—figure supplement 3B, C for comparison of the degree of peak viral amplification across various models. (I) ALO monolayers pretreated for 4 hr with either vehicle (DMSO) control or EIDD-parent (NHC) or its metabolite EIDD-2801/MK-4482 were infected with SARS-CoV-2 and assessed at 48 hpi for infectivity as in (H). Line graphs display the relative expression of E gene. Error bars display SEM. p value **<0.01; ***<0.001.


