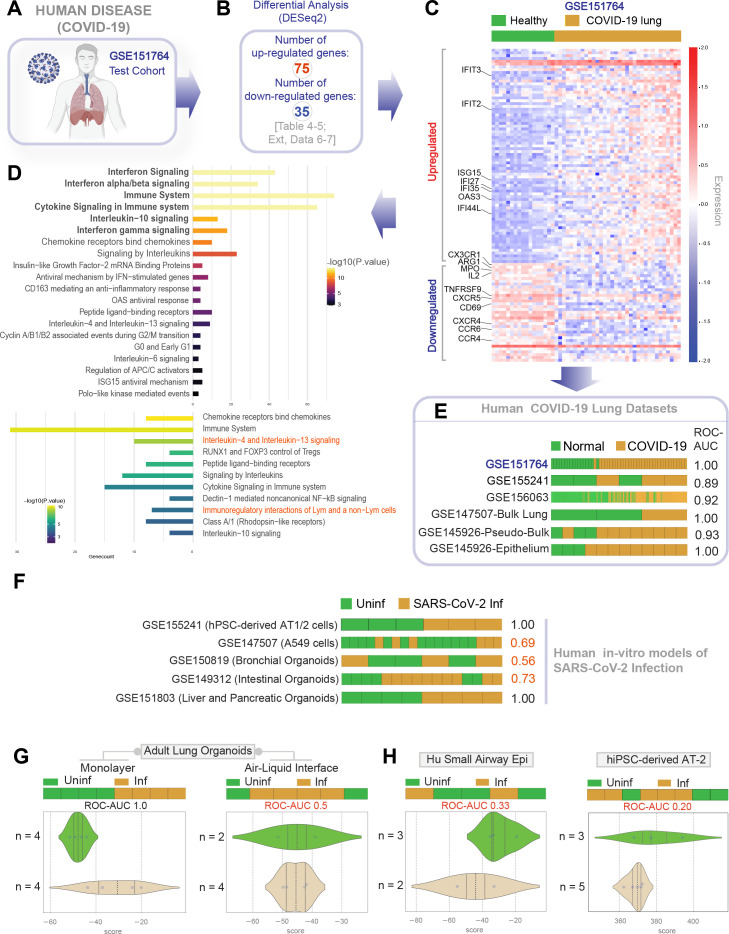
Figure 4. Gene expression patterns in the lungs of patients with COVID-19 (actual disease) are recapitulated in lung organoid monolayers infected with SARS-CoV-2 (disease model).
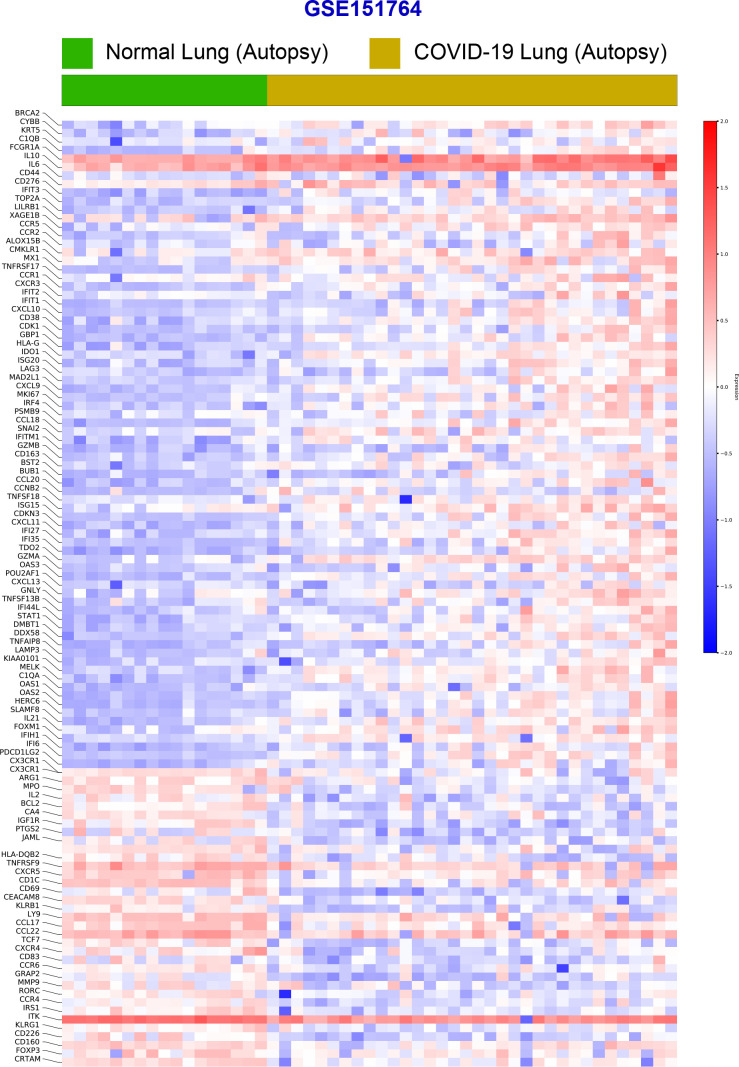
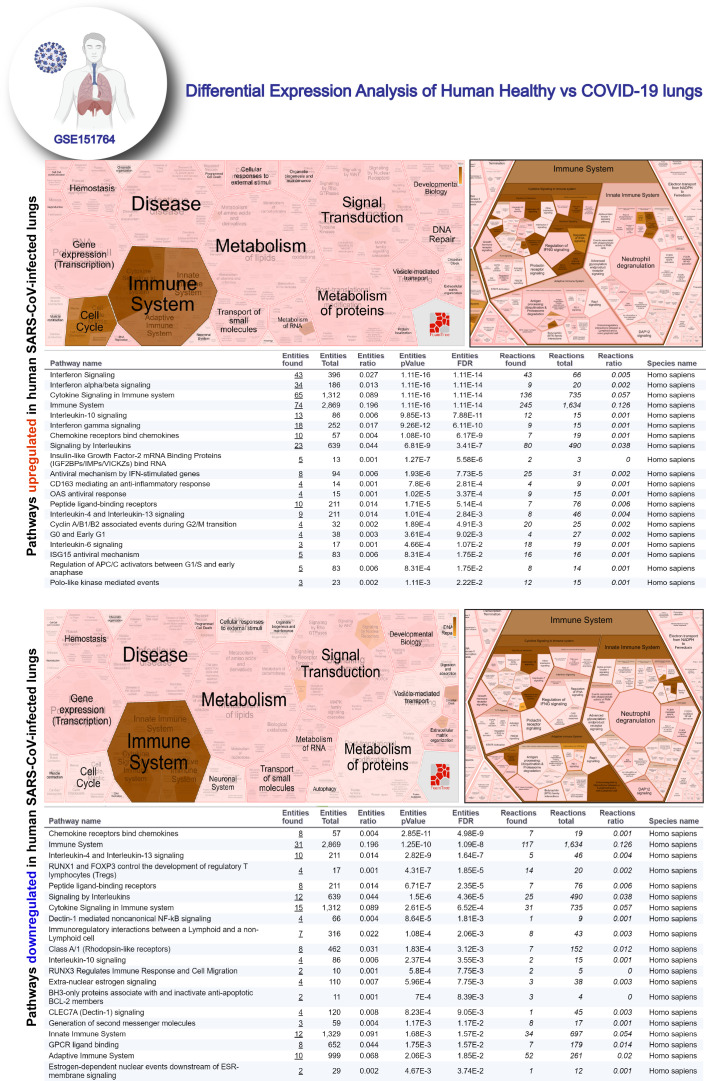
(A–C) Publicly available RNA seq datasets (GSE151764) of lung autopsies from patients who were deceased due to COVID-19 or noninfectious causes (healthy normal control) were analyzed for differential expression of genes (B). The differentially expressed genes (DEGs) are displayed as a heatmap labeled with selected genes in (C). See also Figure 4—figure supplement 1 for the same heatmap with all genes labeled. (D) Reactome-pathway analysis shows the major pathways up- or downregulated in the COVID-19-afflicted lungs. See also Figure 4—figure supplement 2 for visualization as hierarchical ReacFoam. (E) Bar plots display the ability of the DEGs in the test cohort (GSE151764) to classify human COVID-19 respiratory samples from four other independent cohorts. (F) Bar plots display the ability of the DEGs in the test cohort (GSE151764) to classify published in vitro models for SARS-CoV-2 infection where RNA seq datasets were either generated in this work or publicly available. (G, H) Bar (top) and violin (bottom) plots compare the relative accuracy of disease modeling in four in vitro models used in the current work, as determined by the induction of COVID-19 lung signatures in each model. (G) Monolayer (left) and air-liquid interphase (ALI) models (right) prepared using adult lung organoids (ALOs). (H) Primary human small airway epithelium (left) and hiPSC-derived AT2 monolayers (right). Table 6 lists details regarding the patient cohorts/tissue or cell types represented in each transcriptomic dataset.


