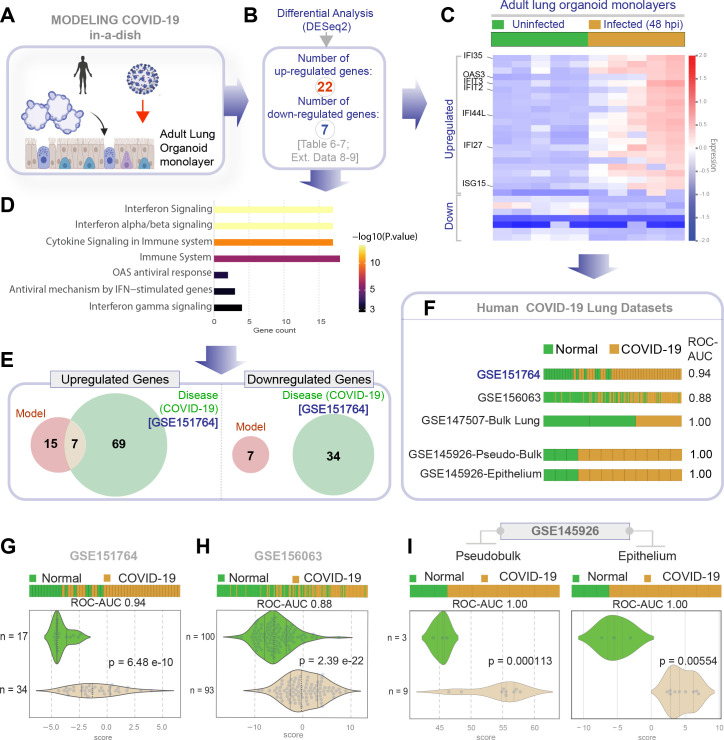
Figure 5. Genes and pathways induced in the SARS-CoV-2-infected lung organoid monolayers (disease model) are induced also in the lungs of COVID-19 patients (actual disease).
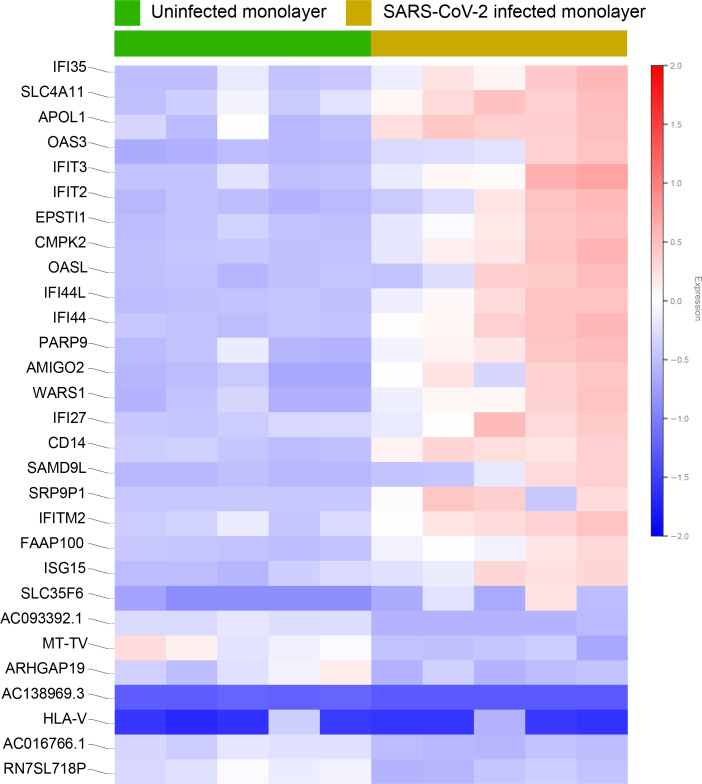
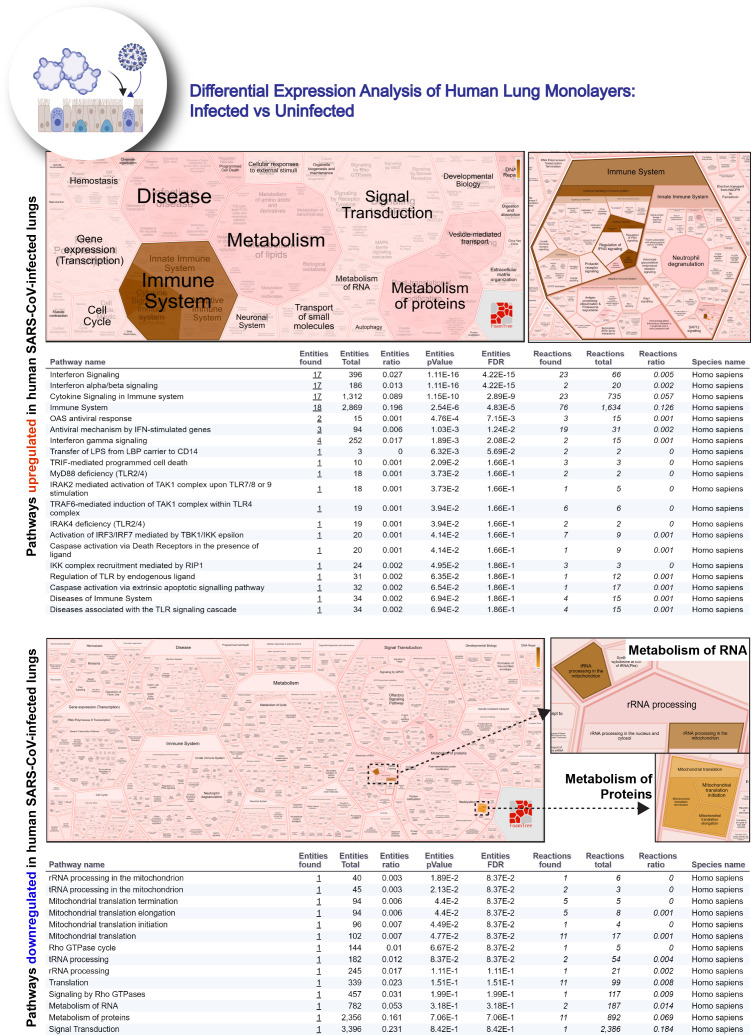
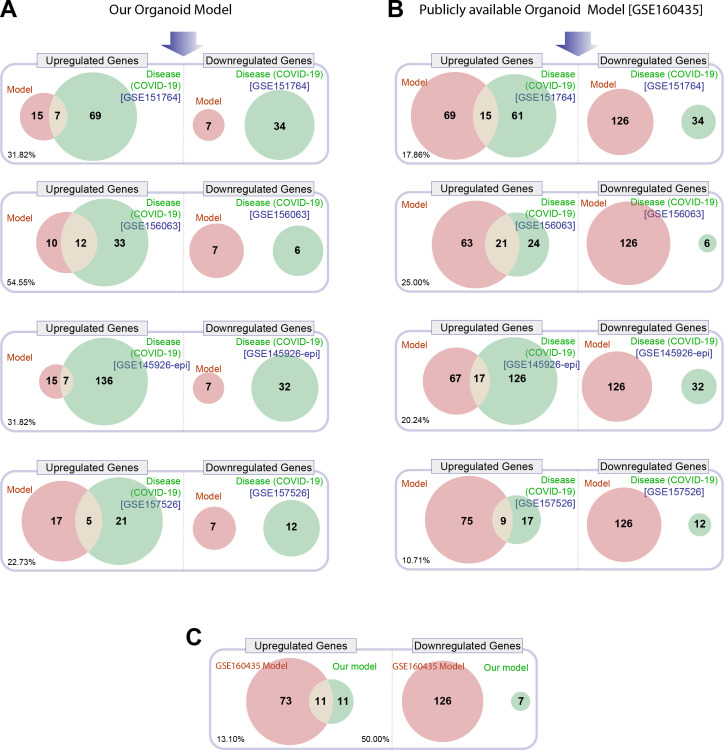
(A–C) Adult lung organoid monolayers infected or not with SARS-CoV-2 were analyzed by RNA seq and differential expression analysis. Differentially expressed genes (DEGs; B) are displayed as a heatmap in (C). While only selected genes are labeled in panel (C) (which represent overlapping DEGs between our organoid model and publicly available COVID-19 lung dataset, GSE151764), the same heatmap is presented in Figure 5—figure supplement 1 with all genes labeled. (D) Reactome-pathway analysis shows the major pathways upregulated in SARS-CoV-2-infected lung organoid monolayers. See also Figure 5—figure supplement 2 for visualization as hierarchical ReacFoam. (E) A Venn diagram showing overlaps in DEGs between model (current work; B) and disease (COVID-19 lung dataset, GSE151764; Figure 4). (F) Bar plots display the ability of the DEGs in infected lung monolayers to classify human normal vs. COVID-19 respiratory samples from five independent cohorts. (G–I) Bar (top) and violin (bottom) plots compare the accuracy of disease modeling in three publicly available human lung datasets, as determined by the significant induction of the DEGs that were identified in the SARS-CoV-2-challenged monolayers. See also Table 6, which enlists details regarding the patient cohorts/tissue or cell types represented in each transcriptomic dataset.


