
Figure 4.
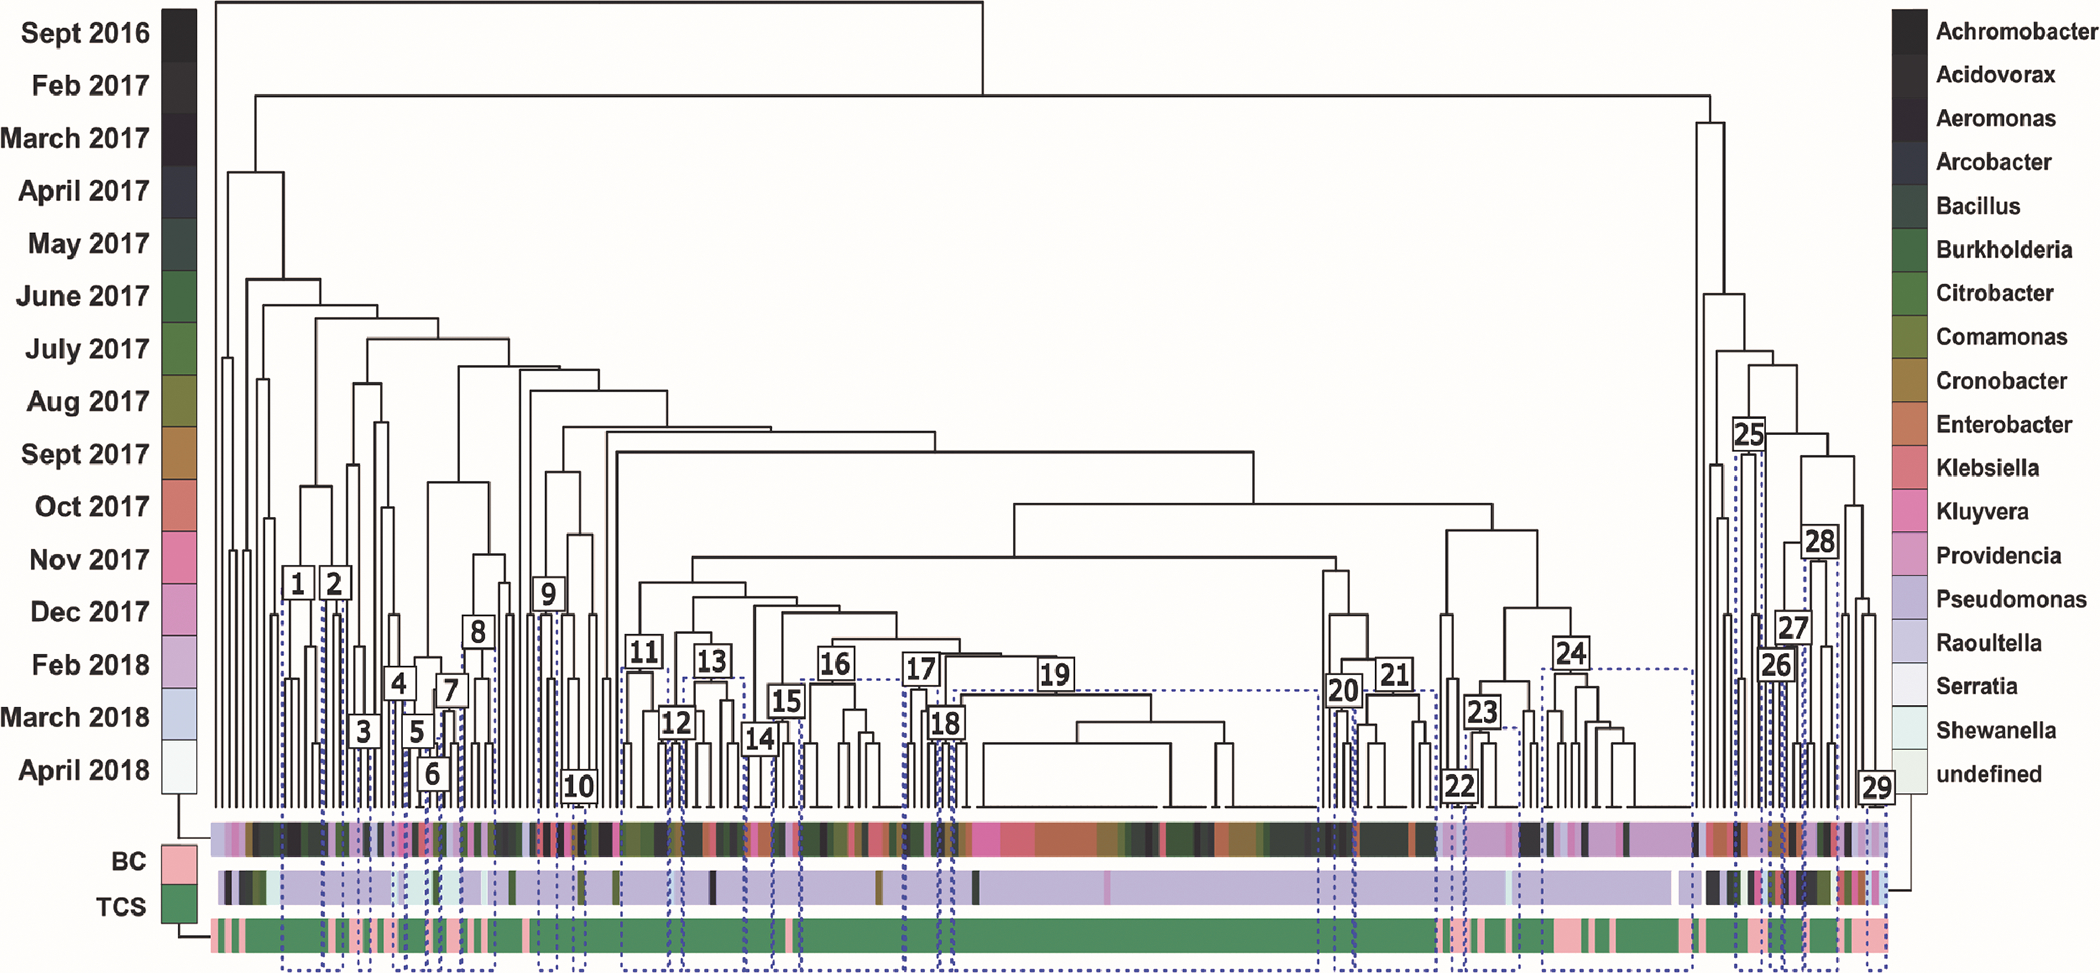
Isolates are clustered by resistance profile using Manhattan distance. Color bars categorize each terminal leaf (unique isolate) by isolation date (row 1), genus (row 2), and isolation media (row 3). Divergent coloring in row 1 indicates increased temporal separation, while similar coloring indicates temporal nearness. Statistically significant clusters (p<0.05) are outlined in blue and labeled numbers 1 through 29.