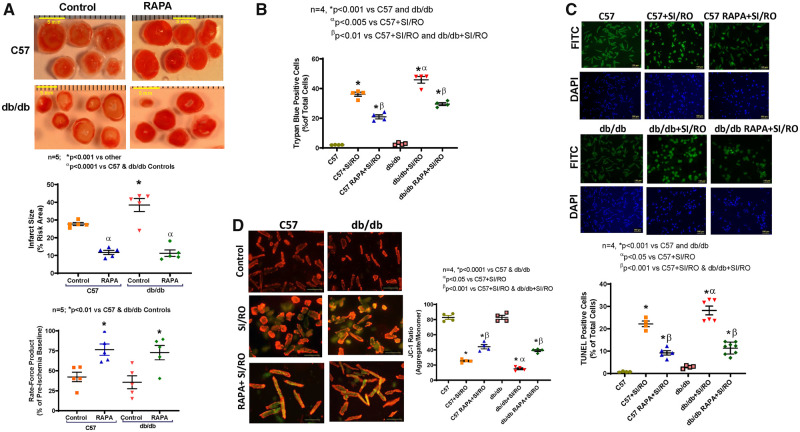
Figure 1.
Cardiac protection following rapamycin treatment in diabetic mice. (A) Representative images of TTC stained heart sections (Scale indicates 5 mm), myocardial infarct size in control and rapamycin (RAPA)-treated C57 and db/db mice following ischaemia/reperfusion (I/R) injury. n = 5 mice/group; *P < 0.001 vs. others and αP < 0.0001 vs. controls. Product of heart rate and ventricular developed force. n = 5; *P < 0.01 vs. controls. (B) Cardiomyocyte necrosis was measured by trypan blue staining following 40 min of simulated ischaemia (SI) and 1 h of reoxygenation (RO). (C) Representative images and quantitative data of cardiomyocytes apoptosis following 40 min SI and 18 h RO. (D) Representative images of JC-1 staining and quantitative data of JC-1 aggregate (red)/monomer (green) ratio. n = 4; *P < 0.001 vs. controls, αP < 0.05 vs. C57+SI/RO, βP < 0.001 vs. C57+SI/RO and db/db+SI/RO. Scale indicates 100 µm. Data are presented as mean ± S.E. Statistics: one-way ANOVA.

