
Figure 2.
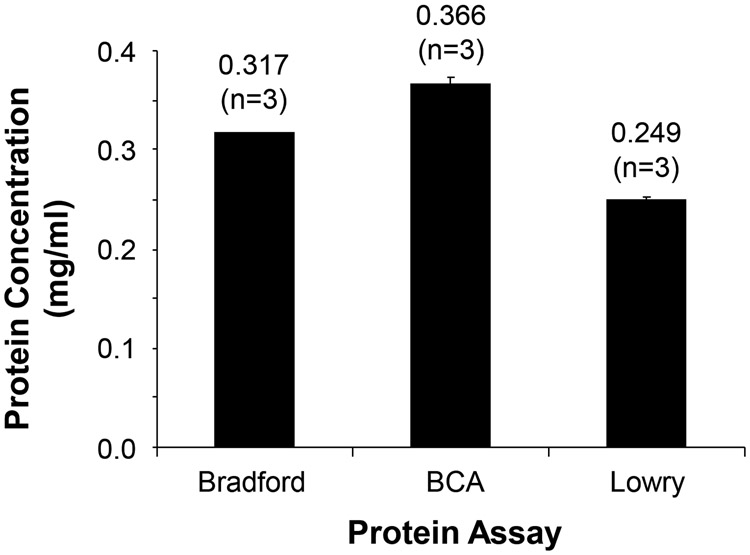
Protein concentration of the same sample was determined using three different protein assay methods (BCA, Bradford, and Lowry). The same bovine serum albumin concentration series were used for generating the standard curve for each method. Error bars indicate standard error of the mean. There is a statistically significant difference among different protein assay methods (p < 0.0001, ANOVA, n = 3 replicates).