Figure 1.

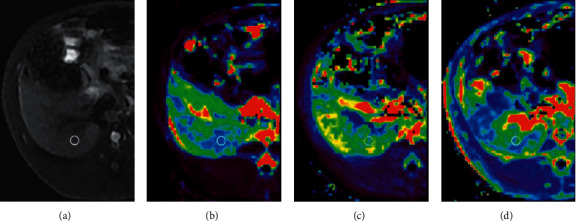
Axial MR images from stage F4 fibrosis. (a) T1WI-FS. (b) Mean values (0.305 mm2/s) shown by the Ktrans map. (c) Mean values (2.475 mm2/s) shown by the Kep map. (d) Mean values (0.167 mm2/s) shown by the Ve map.

Axial MR images from stage F4 fibrosis. (a) T1WI-FS. (b) Mean values (0.305 mm2/s) shown by the Ktrans map. (c) Mean values (2.475 mm2/s) shown by the Kep map. (d) Mean values (0.167 mm2/s) shown by the Ve map.