Figure 2.

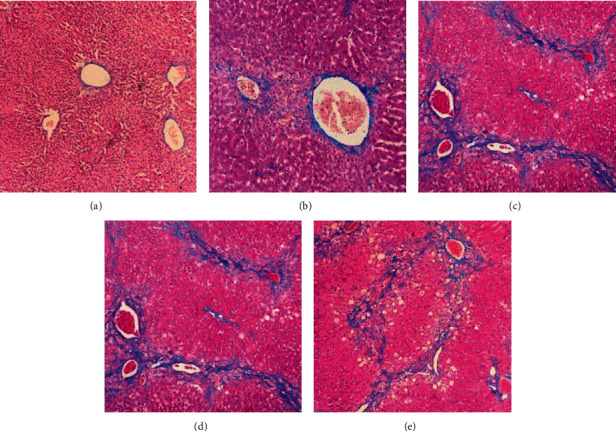
Masson's staining in the experiment group (× 100). (a) F0, no fibrosis. (b) F1, fibrous portal expansion. (c) F2, few bridges or septa. (d) F3, numerous bridges or septa. (e) F4, cirrhosis.

Masson's staining in the experiment group (× 100). (a) F0, no fibrosis. (b) F1, fibrous portal expansion. (c) F2, few bridges or septa. (d) F3, numerous bridges or septa. (e) F4, cirrhosis.