Figure 2.
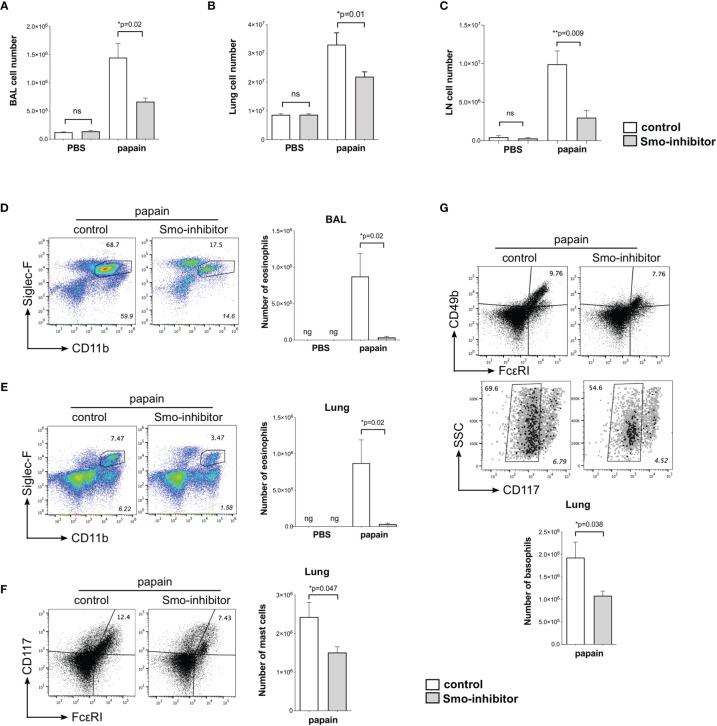
Reduction of inflammatory response upon allergic sensitization by systemic smoothened-inhibitor treatment. Mice underwent the PBS or papain protocol and smoothened inhibitor or control treatment as in Figure 1A. (A–C) Bar charts: mean ± SEM number of cells recovered from (A) BAL, (B) lung, and (C) mLN under different treatments. (D,E) Analysis of eosinophils, giving percentage of eosinophils, from (D) BAL and (E) lung from control and Smo-inhibitor conditions under papain treatment. Italicized numbers indicate percentage of eosinophils in the live gate. Bar chart: mean ± SEM number of eosinophils under different treatments. (F) Flow cytometry: cells from lung stained against CD117 and FcεRI, showing the percentage of CD117+FcεRI+ (mast cells) from control and Smo-inhibitor papain-treated groups. Bar chart: mean ± SEM number of mast cells. (G) Flow cytometry: cells from lung of papain-protocol control and Smo-inhibitor groups to identify basophils (CD49b+FcεRI+CD117-). Non-italicized numbers on plots give the percentage of cells in the regions shown, and italicized numbers indicate percentage of basophils in the live gate. Bar chart: mean ± SEM number of basophils. For (A, B, D–G): PBS groups n = 5 and papain-treated groups n = 6; for (C) PBS groups and papain-Smo-inhibitor n = 5; papain-control group n = 6; ng, negligible; *p < 0.05, **p < 0.01, unpaired Student’s t-test. Data shown are from a representative experiment, and n numbers represent individual mice in the representative experiment shown. n.s., not significant.

