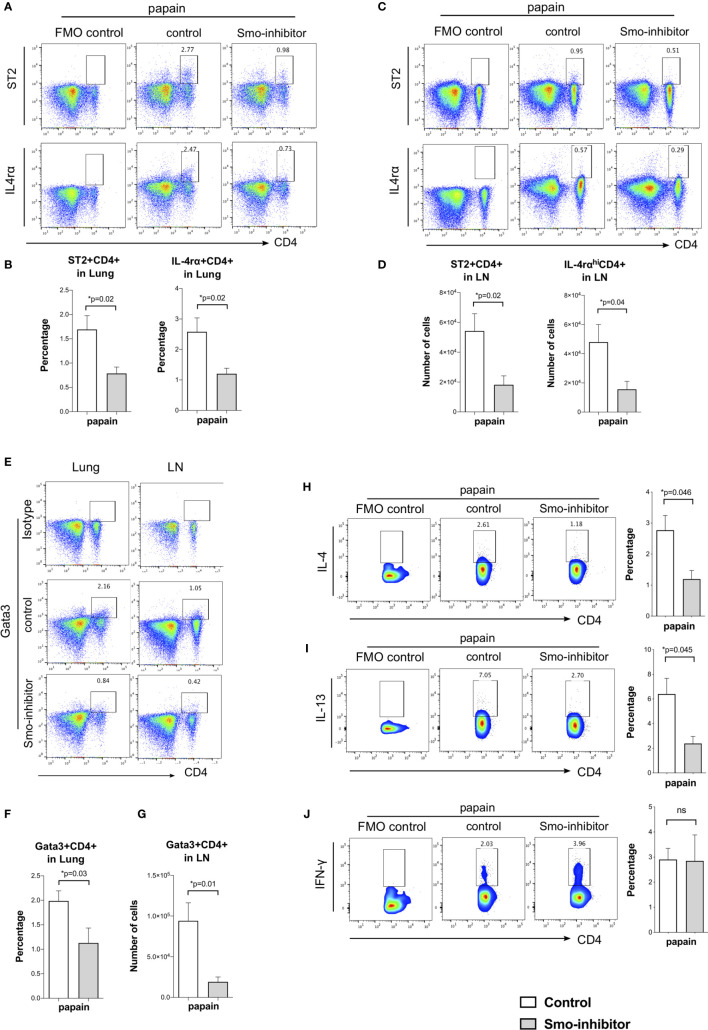
Figure 4.
Smo-inhibitor treatment decreased Th2 differentiation and Th2 inflammation in the murine allergic airway model. (A–D) Facs analysis of Th2 markers in CD4 T-cells from lung and mLN under papain conditions. Facs plots show anti-CD4 and anti-ST2 (upper plots); anti-CD4 and anti-IL-4rα (lower plots) in (A) lung and (C) mLN for control and Smo-inhibitor groups from papain-protocol mice. (B) Bar charts: mean ± SEM percentage of ST2+CD4+ and IL-4rα+CD4+ T-cells recovered from lung under different treatments. In each case, the control plots show negative control. (D) Bar charts: from mLN mean ± SEM number of ST2+CD4+ and IL-4rαhiCD4+ T-cells under papain treatment. (E) Representative Facs plots of CD4 and intracellular Gata3 staining in lung (left) and mLN (right) under papain treatment. In each case, the control plots show staining with an isotype control antibody. (F) Bar chart shows the mean ± SEM percentage of Gata3+CD4+ cells in lung under papain treatment. (G) Bar chart shows mean ± SEM number of Gata3+CD4+ cells in mLN under papain treatment (n = 4). (H) Facs plots (left) show anti-CD4 and anti-intracellular IL-4 staining in mLN gated on CD4+ T-cells in control and Smo-inhibitor groups under papain group treatment. Bar chart shows mean ± SEM percentage of cells that stained positive for IL-4 in CD4+ T-cells in the control and Smo-inhibitor groups under papain treatment (n = 3). (I) Facs plots (left) show anti-CD4 and anti-intracellular IL-13 staining in mLN gated on CD4+ T-cells in control and Smo-inhibitor groups under papain group treatment. Bar chart (right) shows mean ± SEM percentage of CD4 T-cells recovered that stained positive for IL-13 in control and Smo-inhibitor groups under papain treatment (n = 3). (J) Facs plots (left) show anti-CD4 and anti-intracellular IFN-γ staining in mLN gated on CD4+ T-cells in control and Smo-inhibitor groups under papain group treatment. Bar chart (right) shows the mean ± SEM percentage of CD4 T-cells that stained positive for IFN-γ in control and Smo-inhibitor groups after papain treatment (n = 3). In each case, the control plots show negative control. For (A–D, F): PBS groups and papain-Smo inhibitor n = 5; papain-control group n = 6; *p < 0.05 unpaired Student’s t-test. Data shown are from a representative experiment, and n numbers represent individual mice in the experiment shown. n.s., not significant.

