
Fig. 2. Distribution of SnOx in untreated and purified polycrystalline SnSe samples obtained by TOF–SIMS.
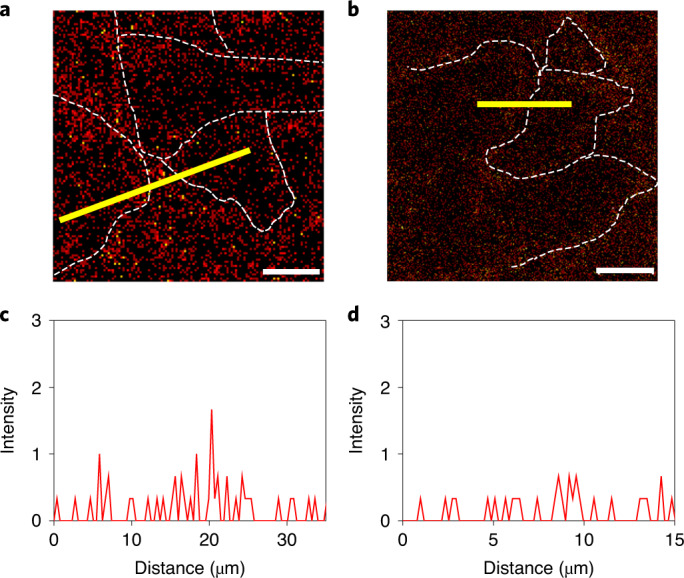
The surface of both SPS-processed specimens was sputtered to generate SnOH+ complex that is a relevant quantity to tin-bound oxygen. Accordingly, the SnOH+ map clearly represents the distribution of surface SnOx on SnSe samples. a, The SnOH+ image for the untreated SnSe sample. b, The SnOH+ image for the purified SnSe sample. The red spots correspond to SnOx. The white dotted lines indicate GBs, which were defined with optical images taken on the corresponding regions. Scale bars are 10 μm. c, The concentration of SnOx across the GB by a line profile (yellow solid line in a) for the untreated SnSe sample. d, The concentration of SnOx across the GB by a line profile (yellow solid line in b) for the purified SnSe sample. The width of a line profile is 3 μm, in which the concentrations of SnOx were averaged. The substantial decrease in surface SnOx is clearly observed by our purification process.