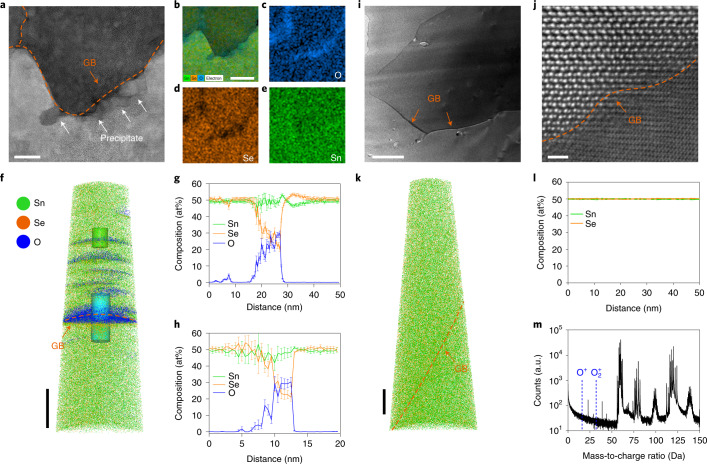
Fig. 3. Distribution and composition of SnOx in untreated and purified polycrystalline SnSe samples.
a, HAADF–STEM image for the untreated polycrystalline SnSe sample, revealing SnOx precipitates around the GBs as indicated by the white arrows. Scale bar, 20 nm. b, Elemental map recorded on the entire area of a by STEM–EDS. Scale bar, 50 nm. c–e, A joint image by overlaying the EDS signals directly arising from O (c), Se (d) and Sn (e) atoms, respectively. f, Three-dimensional APT reconstruction of the untreated polycrystalline SnSe specimen, presenting the spatial distribution of Sn (green), Se (orange) and O (blue) atoms. Scale bar, 50 nm. g,h, One-dimensional compositional profiles showing the content of Sn, Se and O atoms across the GB as enclosed by the blue cylinder (g) and across the oxygen-rich layer as marked by the green cylinder (h) in f, respectively. i, HAADF–STEM image for the purified SnSe sample, confirming the absence of SnOx around the GBs. Scale bar, 200 nm. j, Magnified HAADF–STEM image focusing on the GB, showing two adjacent crystalline grains form the tightly jointed interface without intervening secondary phases. Scale bar, 1 nm. k, Three-dimensional APT reconstruction of the purified SnSe, representing the spatial distribution of Sn (green) and Se (orange) atoms. The O atoms are not detected, verifying the successful removal of SnOx by our two-step purification process. Scale bar, 50 nm. l, One-dimensional compositional profile extracted across the GB, demonstrating an at% ratio of Sn and Se atoms that is nearly constant at unity over the specimen. m, The mass-to-charge ratio spectrum for the purified sample, confirming the absence of signals from O atoms as indicated by the blue dashed lines. The orange arrows and dashed lines in a, f, i, j and k indicate the GBs in the samples.

