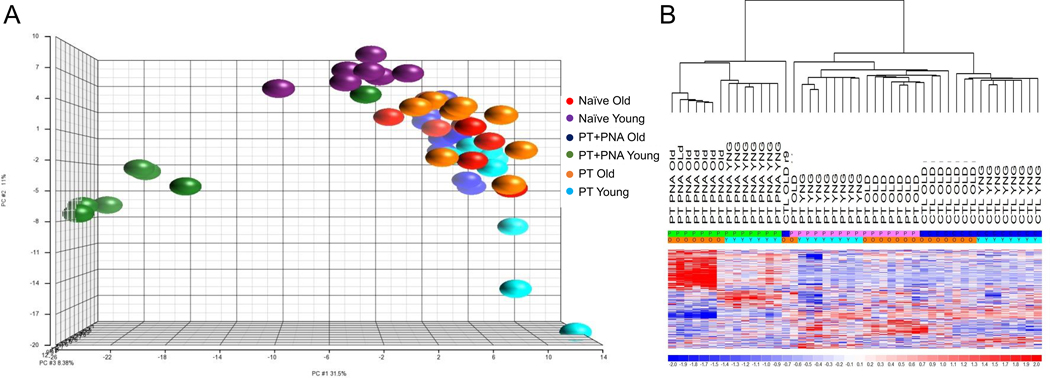
Figure 2. Microarray Transcriptomic Analysis of Hematopoietic Stem and Progenitor Cells between all mouse groups.
The transcriptomic response of isolated HSPCs in naïve, polytrauma (PT), and polytrauma + pneumonia (PT+PNA) mice. (A) Conditional principal component analysis and (B) heat map (log2) of the hierarchical clustering of HSPC miR expression in PT+PNA old versus PT+PNA young versus PT old versus PT young versus naïve old versus naïve young mice (313 miRs significant at p<0.05). C, CTL = Control/Naïve; Y, YNG = young; O = old; P = treated; PT = polytrauma; PT+PNA = polytrauma + pneumonia

